
Ermelinda Damko, Sr. Scientist at Regeneron, shared on LinkedIn:
“A T cell can reach a tumor without reaching a cancer cell. In a killing assay, we usually arrange the meeting ourselves. The opportunity is to study the encounter both ways: first when we bring the cells together, then when the T cell has to find its own target.
Suppose two CAR T designs enter a pooled screen in equal numbers. One becomes abundant but stays at the edge of the tumor nests. The other remains rare but reaches the malignant cells inside. I would take both out of the pool. It is the disagreement that makes them worth testing.
In ‘The Distance Between Contact and Control’ (Data-Rich, Insight-Poor? · CCLXXXIII), I propose testing each design on its own, first where contact is easy, then in tissue where access has to be earned. I would follow what survives the first round of killing and whether it grows back. For claudin 18.2, I would also ask which design leaves more of the stomach lining intact at the same level of tumor control.
If the rarer design wins in tissue but not in the well, what observation would convince you that it found more targets, rather than killing more often once it reached them?
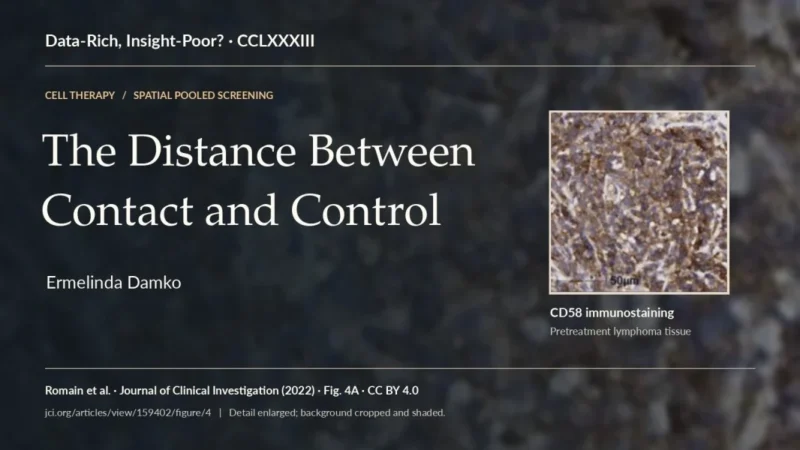
The Distance Between Contact and Control
Hélène Salmon and her colleagues filmed T cells moving through slices of human lung tumors. Along the edge of a cancer cell nest, collagen fibers ran parallel to its boundary. T cells followed the fibers around the nest. When the investigators loosened the collagen, more T cells made contact with cancer cells (Salmon et al., Journal of Clinical Investigation). In a well, we mix the two cell populations and measure what happens after they meet. The assay is useful precisely because it gives us control over an encounter the therapy has to earn in tissue.
That choice of assay becomes a choice about design as soon as its results are used to train a model. Consider a case where the two objectives agree. Four independent software agents searching for heat-tolerant enzymes each found variants at least 12 °C more stable than the starting enzymes after testing less than 2% of the defined sequence space (Rapp, Bremer and Romero, Nature Chemical Engineering). The investigators wanted thermostability; their robot measured it. For a T cell intended to treat a solid tumor, the equivalent choice is less obvious. A receptor that kills more efficiently after contact and a cell that reaches targets its competitors miss could both improve tumor control. Only the first has an obvious advantage in a well where access is assured.
What a contact is worth
Suppose two CAR T designs kill the same number of cancer cells in six hours. One finds targets readily but kills few of the cells it touches. The other rarely makes contact, but when it does, the target usually dies. On the six-hour readout they are tied. For the first design, I would look at what happens at the synapse. For the second, I would follow the cell before it reaches a target.
I would keep the population result and change the denominator for the mechanistic question. Deaths per T cell added tell me what the starting population accomplished, including any advantage from survival or expansion. Following individual contacts long enough to attribute target death tells me how often an encounter succeeded. If a design reaches twice as many targets and kills the same fraction, its advantage disappears when I report deaths per contact. That is a useful correction when studying the synapse and a mistake if I use it to choose the therapy.
In lymphoma cells that lacked CD58, Gabrielle Romain and colleagues restored the protein, which binds CD2 on the T cell. CAR T cells then killed more effectively, and successful encounters took less time before killing (Romain et al., Journal of Clinical Investigation). Imagine examining a section in which few T cells are touching a target. The cells may be slow to find one another. They may also be finishing successful encounters sooner. Counting more pairs would give a more precise estimate of occupancy. Following the cells from first contact to target death would tell us what that estimate means.
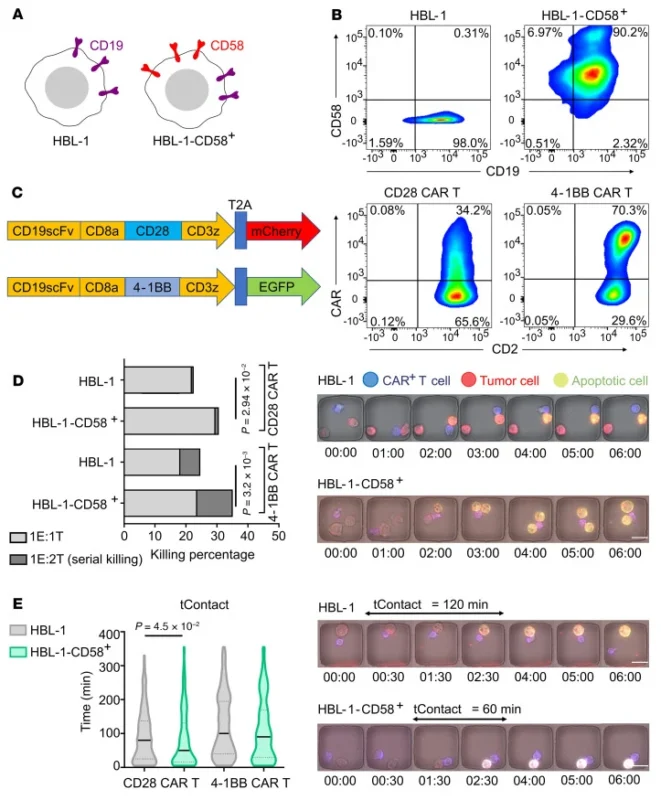
Figure 1. A shorter encounter can be a more productive one. Start with panel D, which compares the ability of CAR T cells to kill lymphoma cells with or without restored CD58. Read it alongside the time-resolved measurements rather than treating duration of contact as a measure of success. The result concerns these cell models, not a universal threshold for a productive encounter. Original figure 3, Romain et al., JCI (2022). © Romain et al., CC BY 4.0.
What survives the pool
A pooled screen gives each engineered design a barcode so investigators can test many designs in the same animal and identify the cells they recover (Waypoint Bio, ‘The Missing Dimension in Pooled Screens’). A barcode can establish that a design’s share of the recovered pool has doubled. Its absolute cell count may not have changed at all if enough of its competitors disappeared.
An absolute count would settle the question of abundance and still leave the question Salmon’s experiment raised. Two designs can be equally abundant in a tumor while one remains in the stroma and the other reaches malignant epithelium. Dissociate the tissue and those two populations can look alike. In a section, their positions are part of the measurement.
Suppose two designs enter a pool in equal numbers. At harvest, one accounts for a tenth of the recovered CAR T cells and the other for a hundredth. The first is concentrated along a stromal boundary. The second is sparse, but most of its cells lie inside antigen-positive tumor nests. If I rank by enrichment, the first wins. If I want a cell that can enter a tumor nest, the second deserves a closer look. Neither observation tells me how much living tumor either design would leave behind if given on its own.
In a pancreatic cancer model, Megha Sah and colleagues identified more than 200 CAR T designs in situ and measured 20 – 30 protein markers in the same sections (Sah et al., SITC 2024). I would read those sections twice. First, which designs reached regions containing cancer cells? Then, among designs with comparable access and nearby antigen, how did the condition of the neighboring cancer cells differ? Starting with the second comparison would make access a condition of entry into the analysis. A design that improved access might never get credit for it.
There is a denominator on the tissue side, too. A large tumor nest offers more room for a T cell to land in it; a narrow nest with a long perimeter offers more opportunities to appear close to the boundary without crossing it. I would compare cells per unit of malignant tissue as well as the fraction of each design found inside it. I would also keep the counts for each tumor visible. Six cells inside a small nest and six hundred cells distributed across several tumors might produce the same percentage. I would not put the same weight on the two estimates.
The cancer cells can help determine that geography. In an independent mouse lung cancer study, the Perturb-map screen identified tumor lesions in which loss of the tumor-cell TGF-β receptor Tgfbr2 was accompanied by a fibro-mucinous microenvironment and T-cell exclusion (Dhainaut et al., Cell). That was a screen of cancer-cell perturbations, not a validation of any CAR T design. It offers a useful counterexample to the instinct to credit every difference in infiltration to the T cell. If one design is recovered mostly from permissive lesions, I would want to know how it fared in lesions that its competitors also had difficulty entering.
Sharing a tumor lets investigators compare designs in the same host. It also allows one design to change the conditions in which another is judged. In glioblastoma models, interferon-γ signaling in tumor cells supported the adhesion needed for contact-mediated killing (Larson et al., Nature). In a different system, interferon-γ released by CD4-positive CAR T cells induced death at a distance in susceptible cancer cells, including cells without the target antigen (Boulch et al., Nature Cancer). Neither study identifies the mechanism in the pancreatic screen. They do establish why I would stop short of assigning a death to the nearest barcode.
Which design would I take out of the pool?
Sah and colleagues selected 18 designs for individual mouse efficacy studies. They reported that novel designs outperformed controls, consistent with the pooled spatial rankings (Sah et al., SITC 2024). For someone deciding what to advance, this is the consequential result. A property observed while many designs shared a tumor helped identify therapies that retained activity when administered separately. It is evidence for nomination. It does not establish the exact order of all 200-plus designs, or how many good candidates a simpler screen would have found.
The group’s later conference report makes the prediction problem clearer. In pancreatic xenografts, they profiled more than 250 designs and approximately 20 million total cells, not 20 million CAR T cells. For each library, 30 – 40 sections sampled different mice, donor products, and time points. A cross-validated random forest related combinations of spatial phenotypes to tumor shrinkage in single-construct studies. The investigators reported superior efficacy for selected constructs in multiple xenograft models (Sah et al., AACR 2025). The two reports are preclinical conference abstracts. Neither establishes that a spatial score predicts benefit in patients.
What was held out matters more to me here than the choice of algorithm. For a new donor, I would want a prediction made without that donor’s cells in training. For a new receptor design, I would want the design itself held out. A neighboring section from a familiar tumor asks an easier question than either. Millions of cells can locate a rare neighborhood with remarkable precision; they cannot turn one treated animal into several independent tests of efficacy. The AACR abstract reports cross-validation but does not specify the split in enough detail to settle which of these predictions was tested (Sah et al., AACR 2025).
The assay I would run next
I would spend the next comparison on two designs the screens rank in opposite order. Call the enrichment winner A and the tissue-access winner B. Before seeing either result, I would record those predictions and define a win as sustained suppression of viable tumor, not an early fall in cell count. This is the follow-up I would propose, not an experiment reported by Sah and colleagues.
I would test A and B separately, alongside the same reference CAR T product, using cells from the same donor at matched viable CAR-positive input. Tumor material from each specimen would be split between a mixed-cell assay, where access is relatively easy, and an intact tissue assay, where the cells must reach malignant nests. Tumor without added T cells gives the background death rate; donor-matched T cells without the targeting receptor help distinguish receptor-dependent activity from injury those cells can cause without it. Dissociation changes more than geometry. A reversal between the two assays would tell me where to look, not yet why B won.
In intact tissue, I would count distinct malignant targets reached per viable effector-hour and record whether the encounters occurred inside a nest or at its edge. Then I would ask what fraction of first contacts was followed by target death within a prespecified interval. Five visits to one target are not five targets found. If several effectors converge before a cell dies, I would count the death in the tumor readout without assigning it to any one encounter. Contacts too late in the recording to observe their outcome would remain unresolved rather than being scored as failures.
If B reaches more targets in intact tissue but has no advantage after contact, I would investigate access. If the designs reach comparable numbers of targets but more of B’s encounters end in death, I would turn to the synapse. A third result is just as useful: B may leave less viable tumor without improving either rate because more of its T cells survive or expand. I would keep the total effect and revise the explanation. Dividing out the extra effector-hours is appropriate for studying individual cells, not for deciding that the product did nothing better.
The decision would rest on residual viable tumor and subsequent regrowth over a prespecified interval during which control tissue remains viable. A candidate that clears visible targets first but permits earlier regrowth has not won on durability. I would estimate the A–B difference within each donor and tumor specimen; fields and contacts contribute to that estimate rather than counting as independent experiments. A reproducible advantage would justify an independent single-design efficacy study. The tissue assay itself cannot establish durable control in an animal, much less a patient.
The tissue that should survive
For a CAR T cell directed against claudin 18.2, I would want to know what happened to the stomach lining at the exposure that controlled the tumor. Normal gastric epithelium also expresses the target (Carstens et al., Nature Communications). In a randomized trial in previously treated CLDN18.2-positive gastric or gastroesophageal junction cancer, median progression-free survival was 3.25 months with satri-cel and 1.77 months with physician’s choice (Qi et al., The Lancet). In a separate phase 1 study, eight of 98 recipients had gastric mucosal injury (Qi et al., Nature Medicine). Those findings belong to satri-cel. They give the preclinical comparison a purpose, not a clinical outcome to claim for another design.
Elizabeth Carstens and colleagues compared CLDN18.2 receptors in mice bearing OE19 tumors. With 5795-VH, the lowest-affinity binder tested, no mouse required early euthanasia for toxicity. Most initially cleared their tumors, but tumors later recurred. Median overall survival was 124 days, compared with 39 days for the CT041-derived comparator (Carstens et al., Fig. 4D–E). If I were training a model on these data, I would enter 124 days under survival. Entering it under tumor control would teach the model that recurrence had not happened.
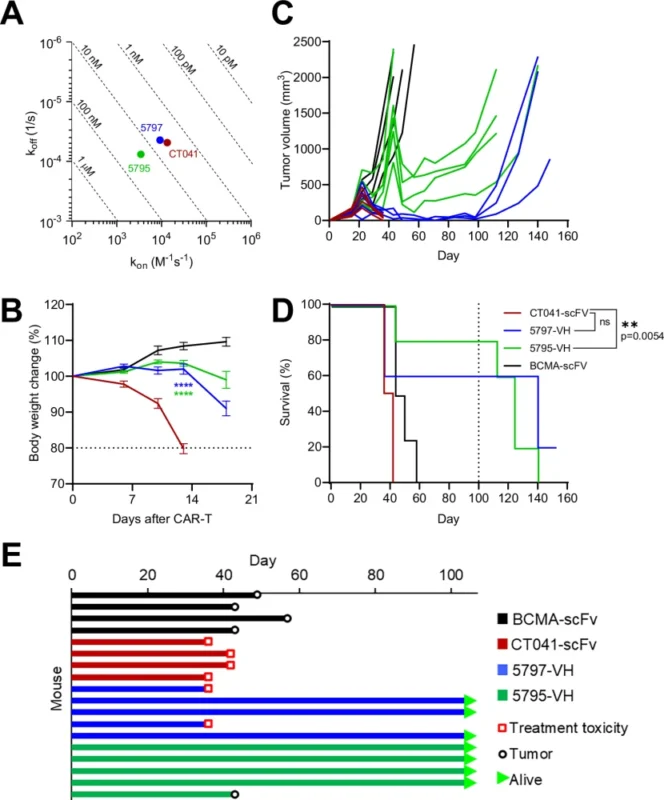
Figure 2. Surviving longer is not the same as remaining tumor-free. Read the tumor-volume curves in C alongside overall survival in D; panel E shows why individual animals reached an endpoint. These are different questions about the same OE19 experiment. Early tumor clearance, recurrence and toxicity cannot be recovered from a survival curve alone. Original figure 4, reproduced intact from Carstens et al., Nature Communications (2025). © The Author(s), CC BY-NC-ND 4.0.
The stomach histology came from a separate pancreatic tumor experiment, not from the mice in those survival curves. The illustrated CT041-scFv stomach showed near-complete atrophy and erosion; the 5795-VH stomach showed little, if any, disruption (Carstens et al., Supplementary Figs. 8–9). Each image represents one animal. It shows what injury looked like, not how often it occurred. The binders also differed in which extracellular residues they needed for recognition, so the comparison cannot assign the difference to affinity alone (Carstens et al., Supplementary Fig. 7).
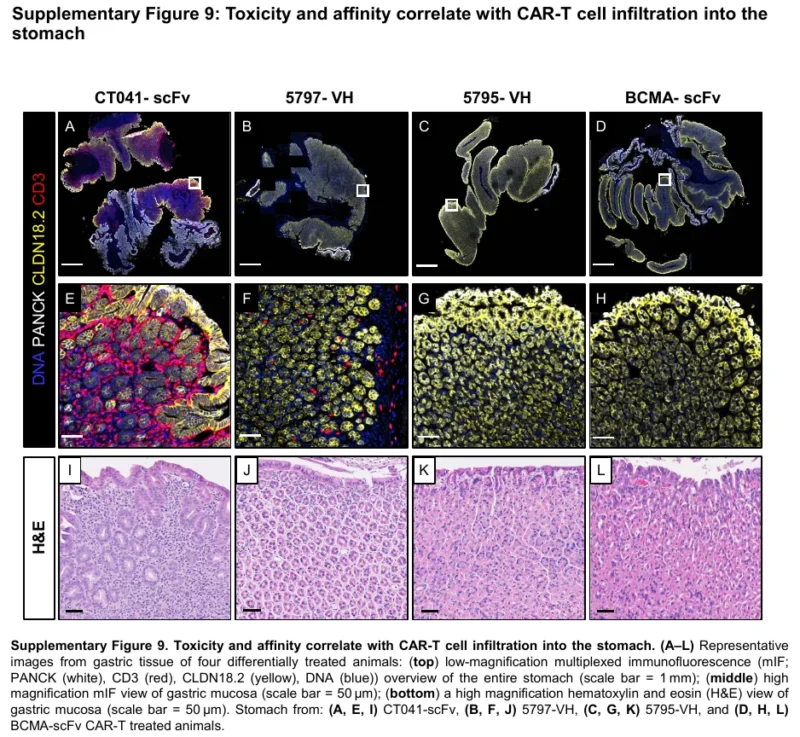
Figure 3. Look at the organ the therapy was meant to spare. Read down each column: the top row locates cells across the stomach, the middle row magnifies the lining, and the bottom row shows tissue architecture. Compare I (CT041-scFv) with K (5795-VH). The control is L. Each column represents one animal, not an estimate of injury incidence. Supplementary figure 9, reproduced intact from Carstens et al., Supplementary Information (2025). © The Author(s), CC BY-NC-ND 4.0.
For this target I would add intact, CLDN18.2-expressing gastric mucosa to the comparison and score epithelial loss, erosion, and preserved gland architecture without revealing the design identity to the reader. Equal input answers what happens when the two products are offered the same opportunity to cause injury. Matched tumor suppression asks what each costs for the same benefit. I would specify the magnitude and duration of suppression before reviewing the gastric histology. A design that never reaches the tumor criterion has no matched safety comparison. If both reach it and one consistently preserves the lining, the normal tissue has settled a choice the tumor alone could not.
I would keep the simpler screen if, in a prospective comparison, its choices controlled tumors for as long and spared healthy tissue just as well. What would change my mind is a design the simpler assay rejects, the spatial assay favors, and the individual experiment vindicates. If you know a public study where that happened, I would welcome it, particularly if the investigators traced the reversal to how the cells reached their targets or what happened once they met. This essay is my independent interpretation of public research.”
You can also read:
- 20 Heme-Onc Posts Not to Miss from October
- CAR T-Cell Therapy Recovery Time: Timeline After Infusion and Follow-Up