


Hui Huang, Co-Founder & Board Member Etheros HealthData Foundation, Founder and CEO atcCSD Partners LLC, shared a post on LinkedIn:
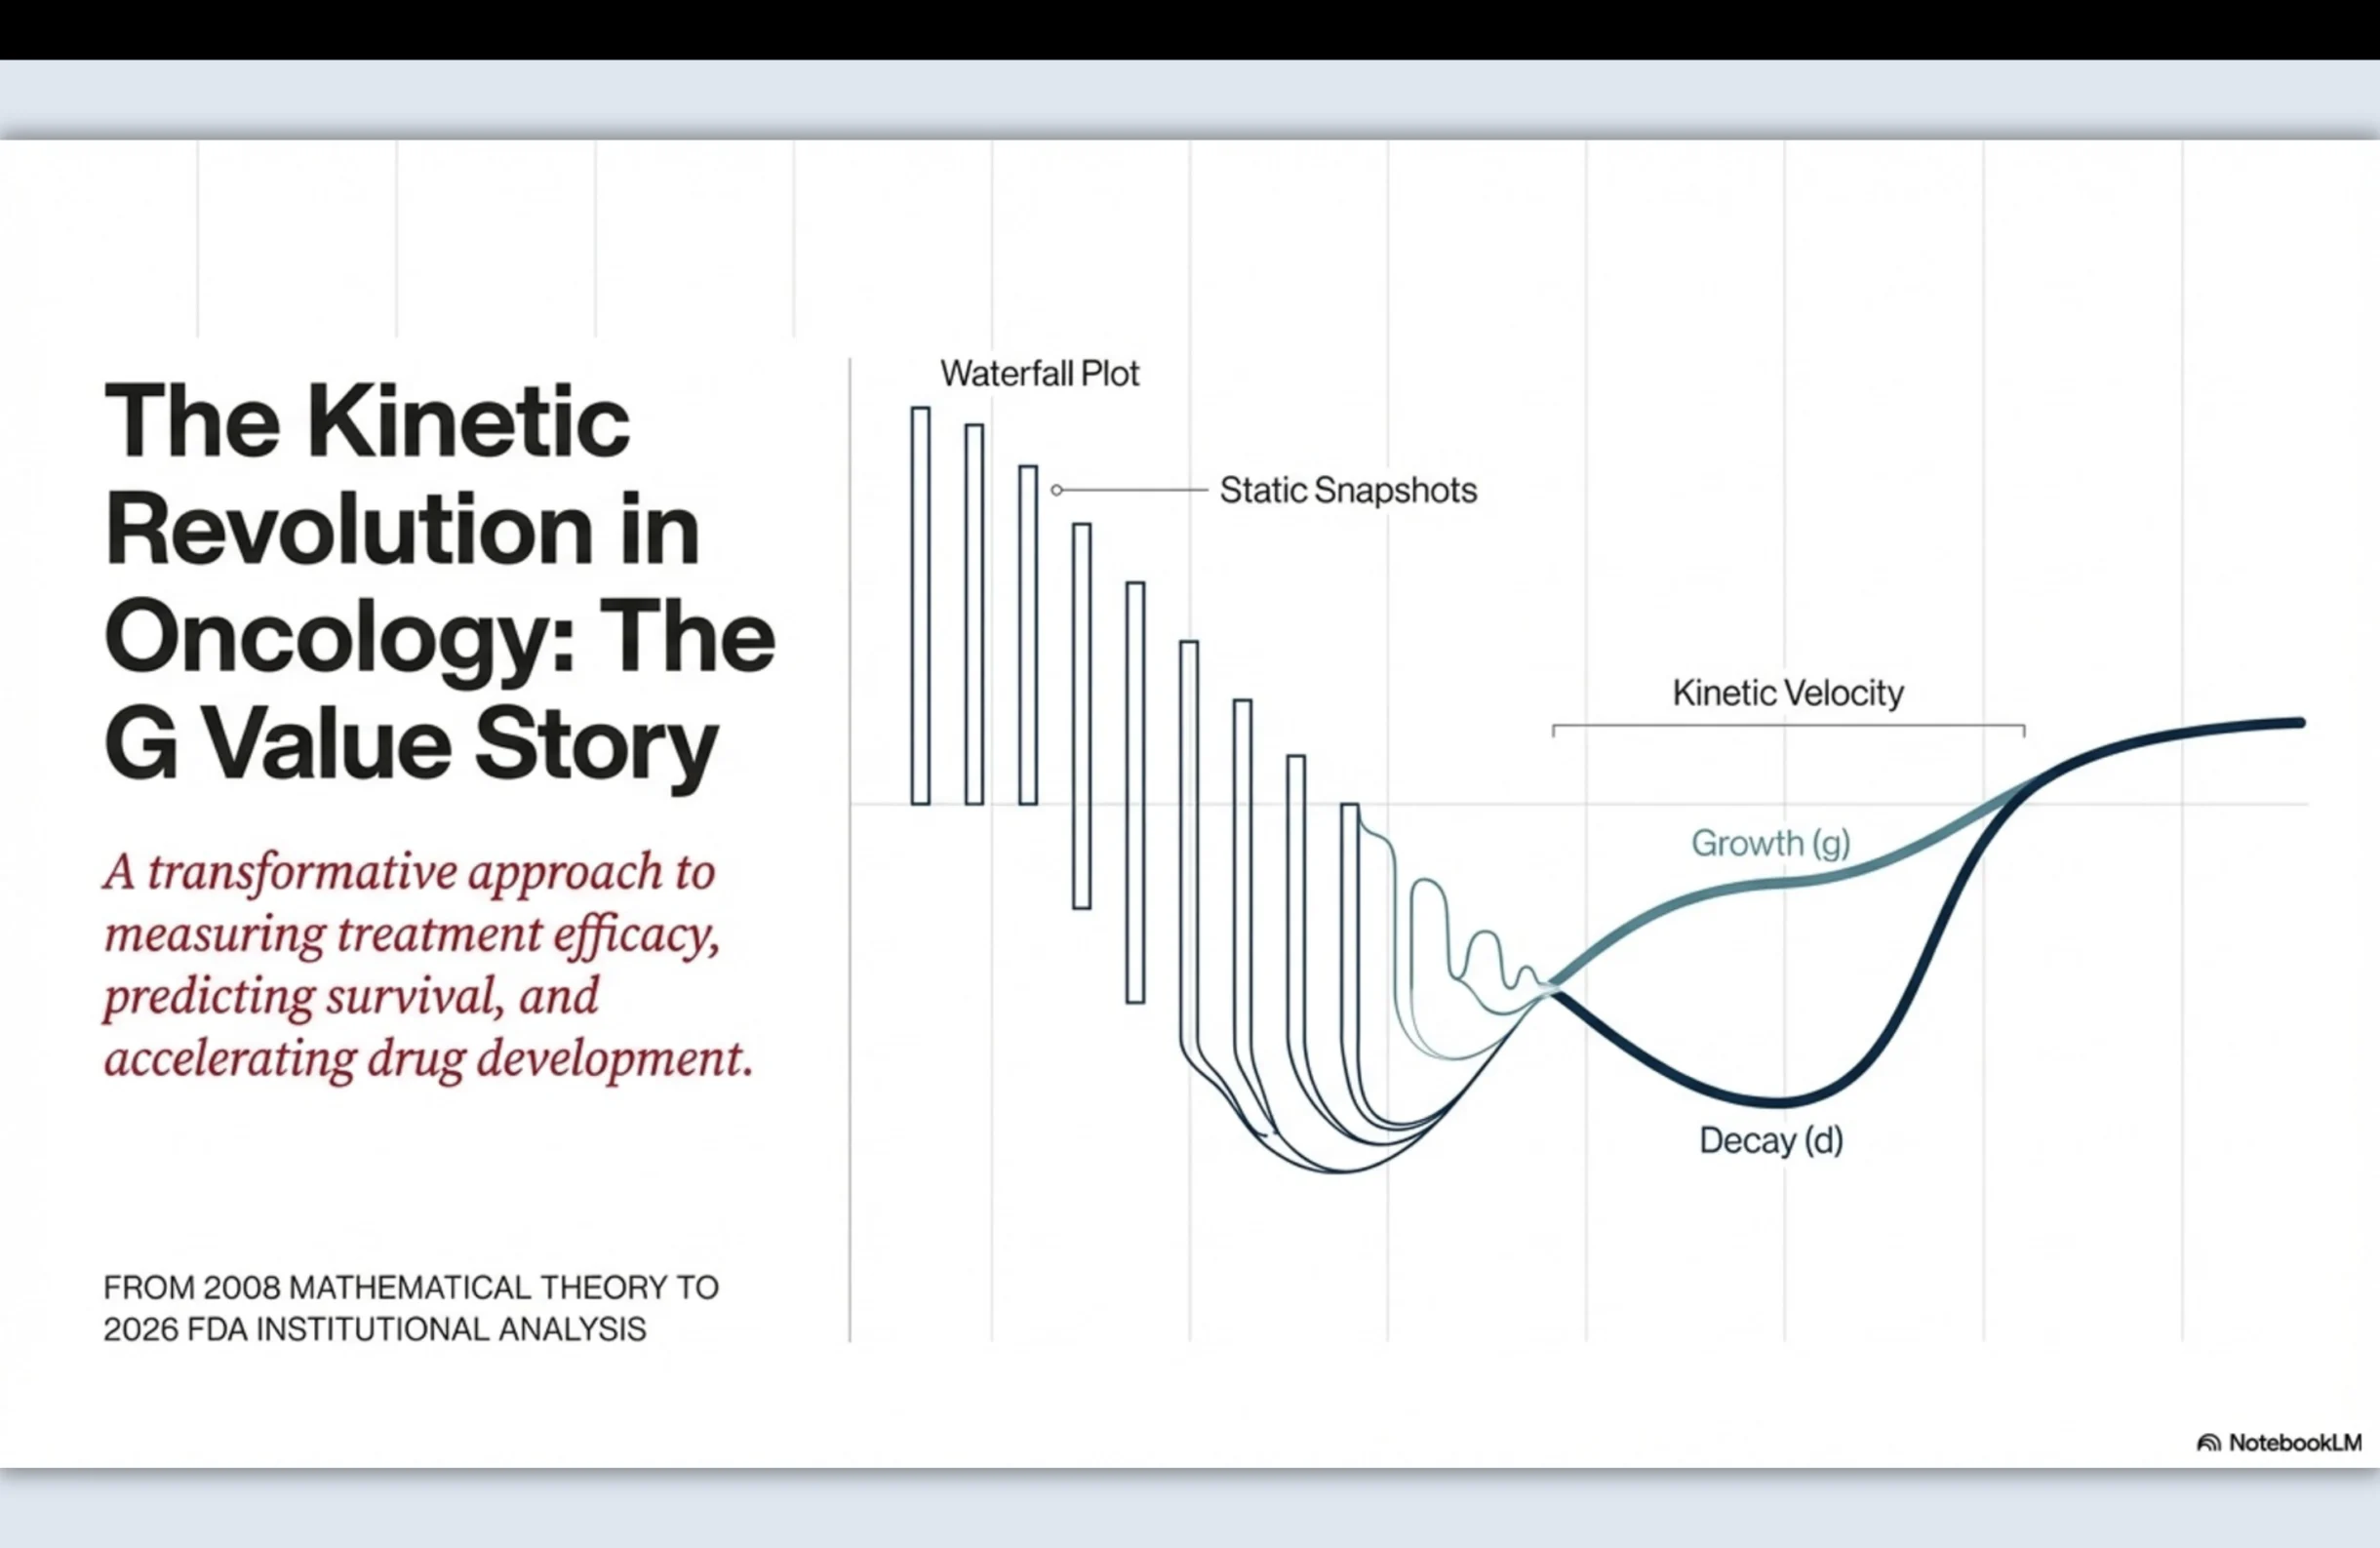
“Have you heard of ‘g value’ in oncology? It may turn out to be a metric that changes how we think about solid tumor trials. I’ve been following this line of work for years. What caught my attention this week isn’t that the idea is new — it isn’t — but that the FDA is now willing to ask the question in public.
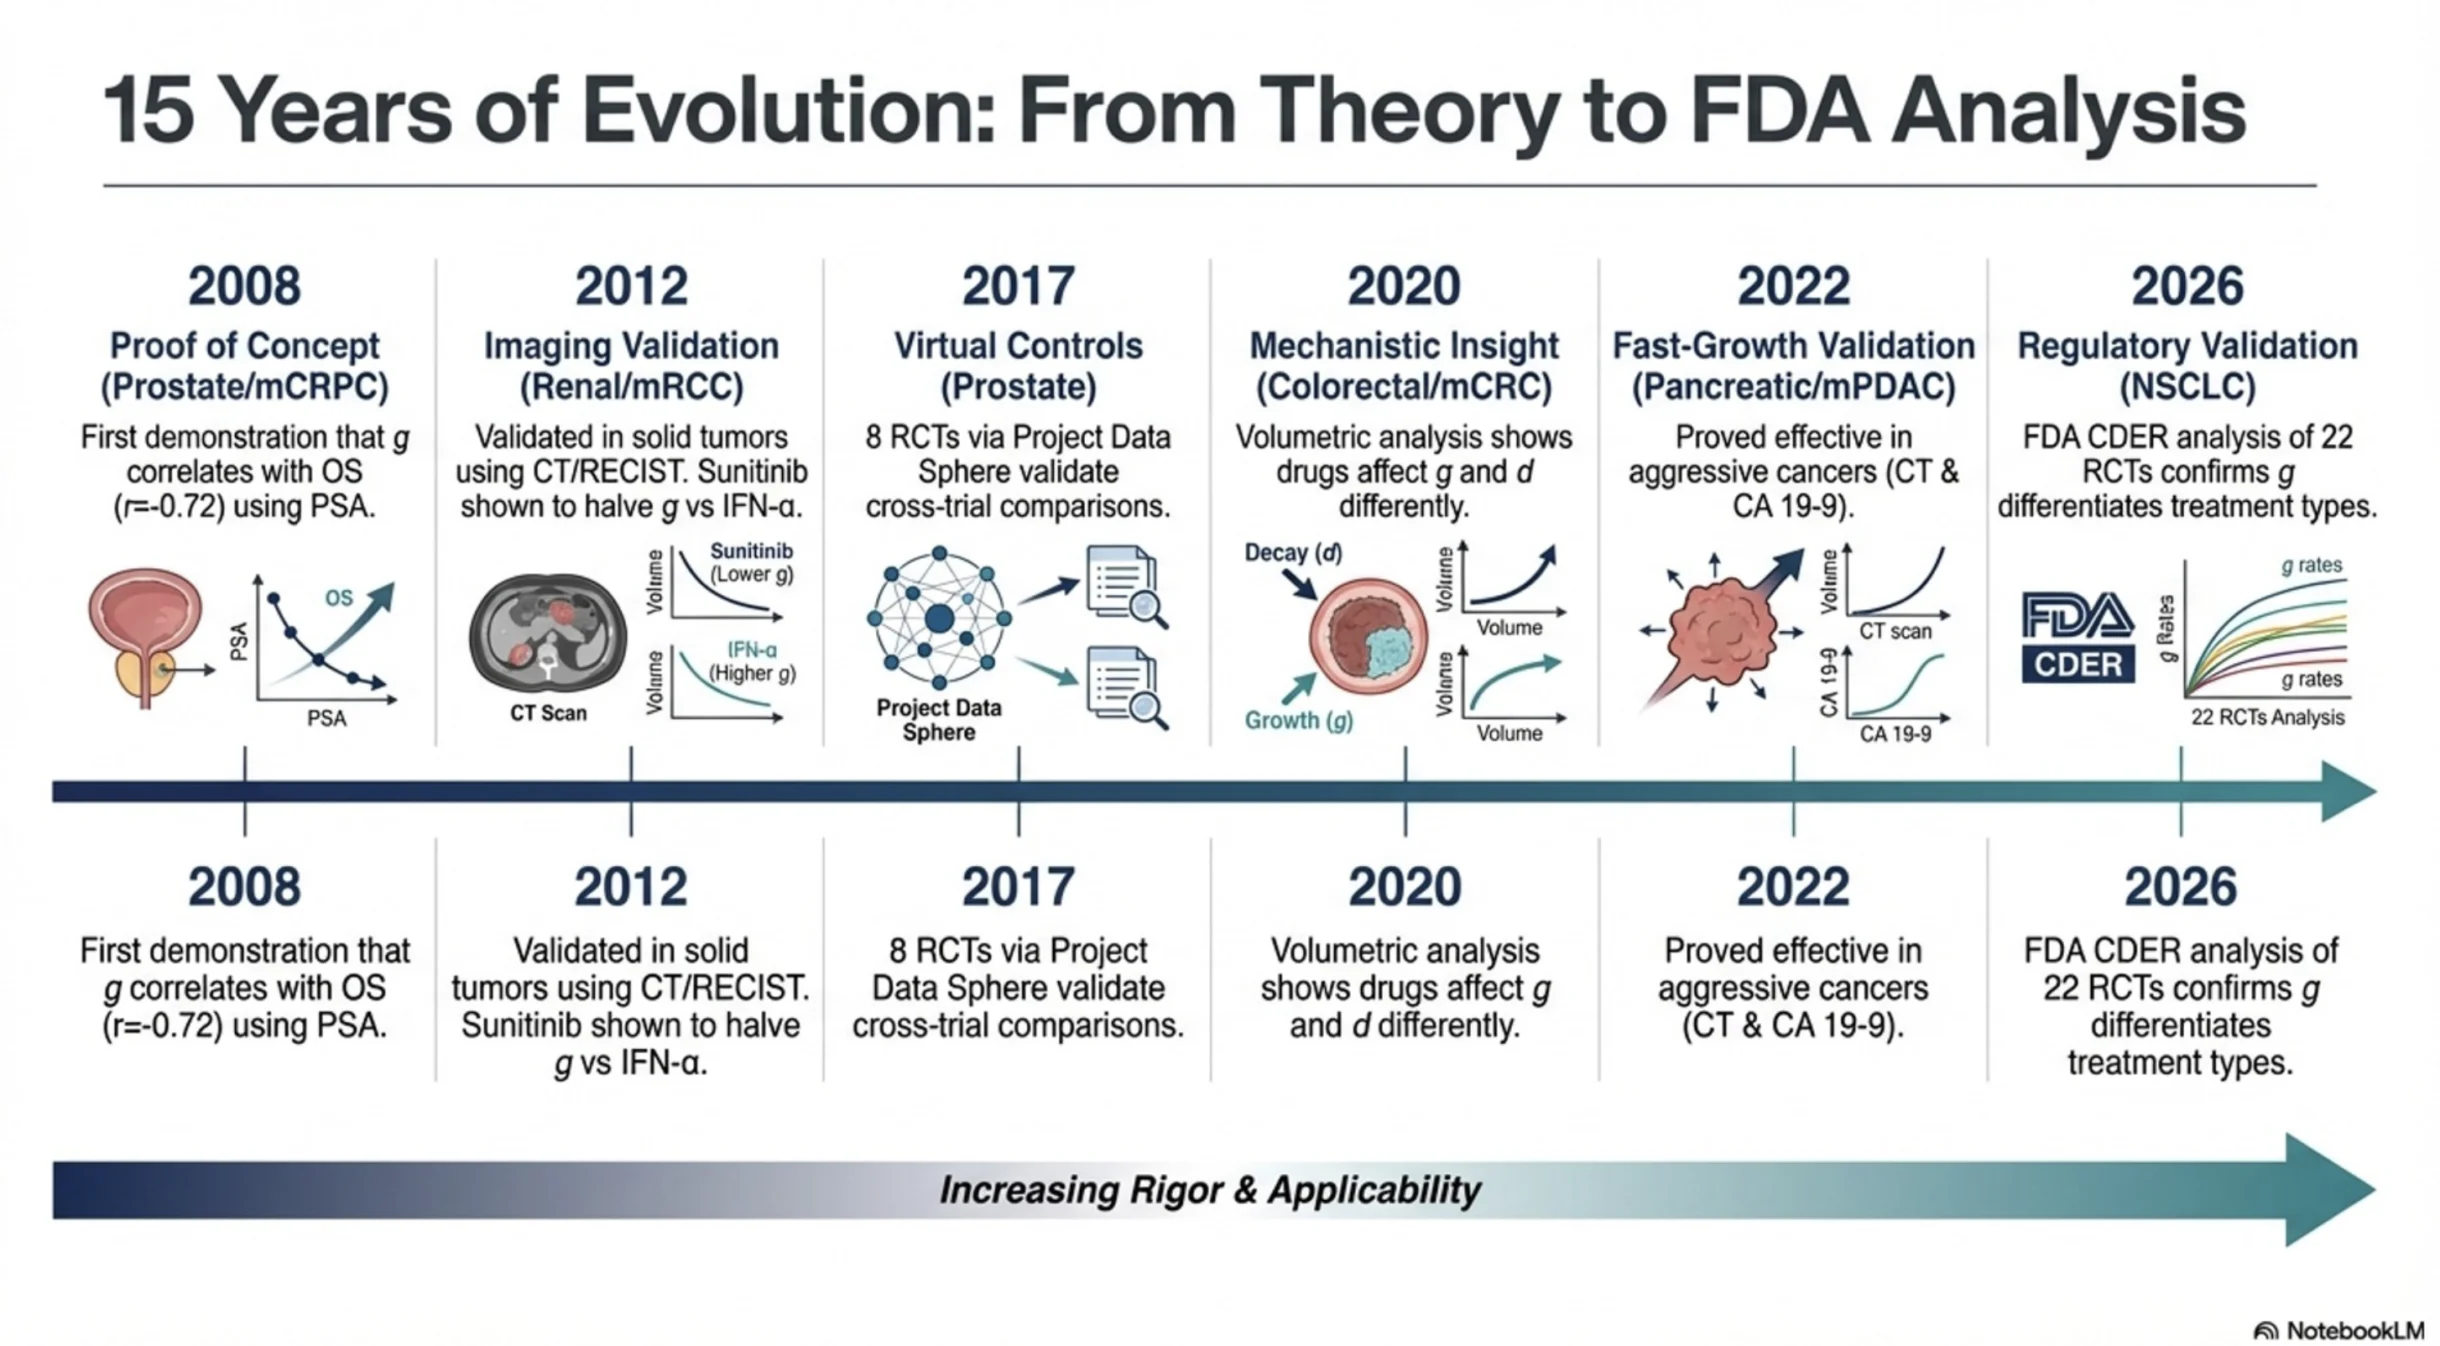
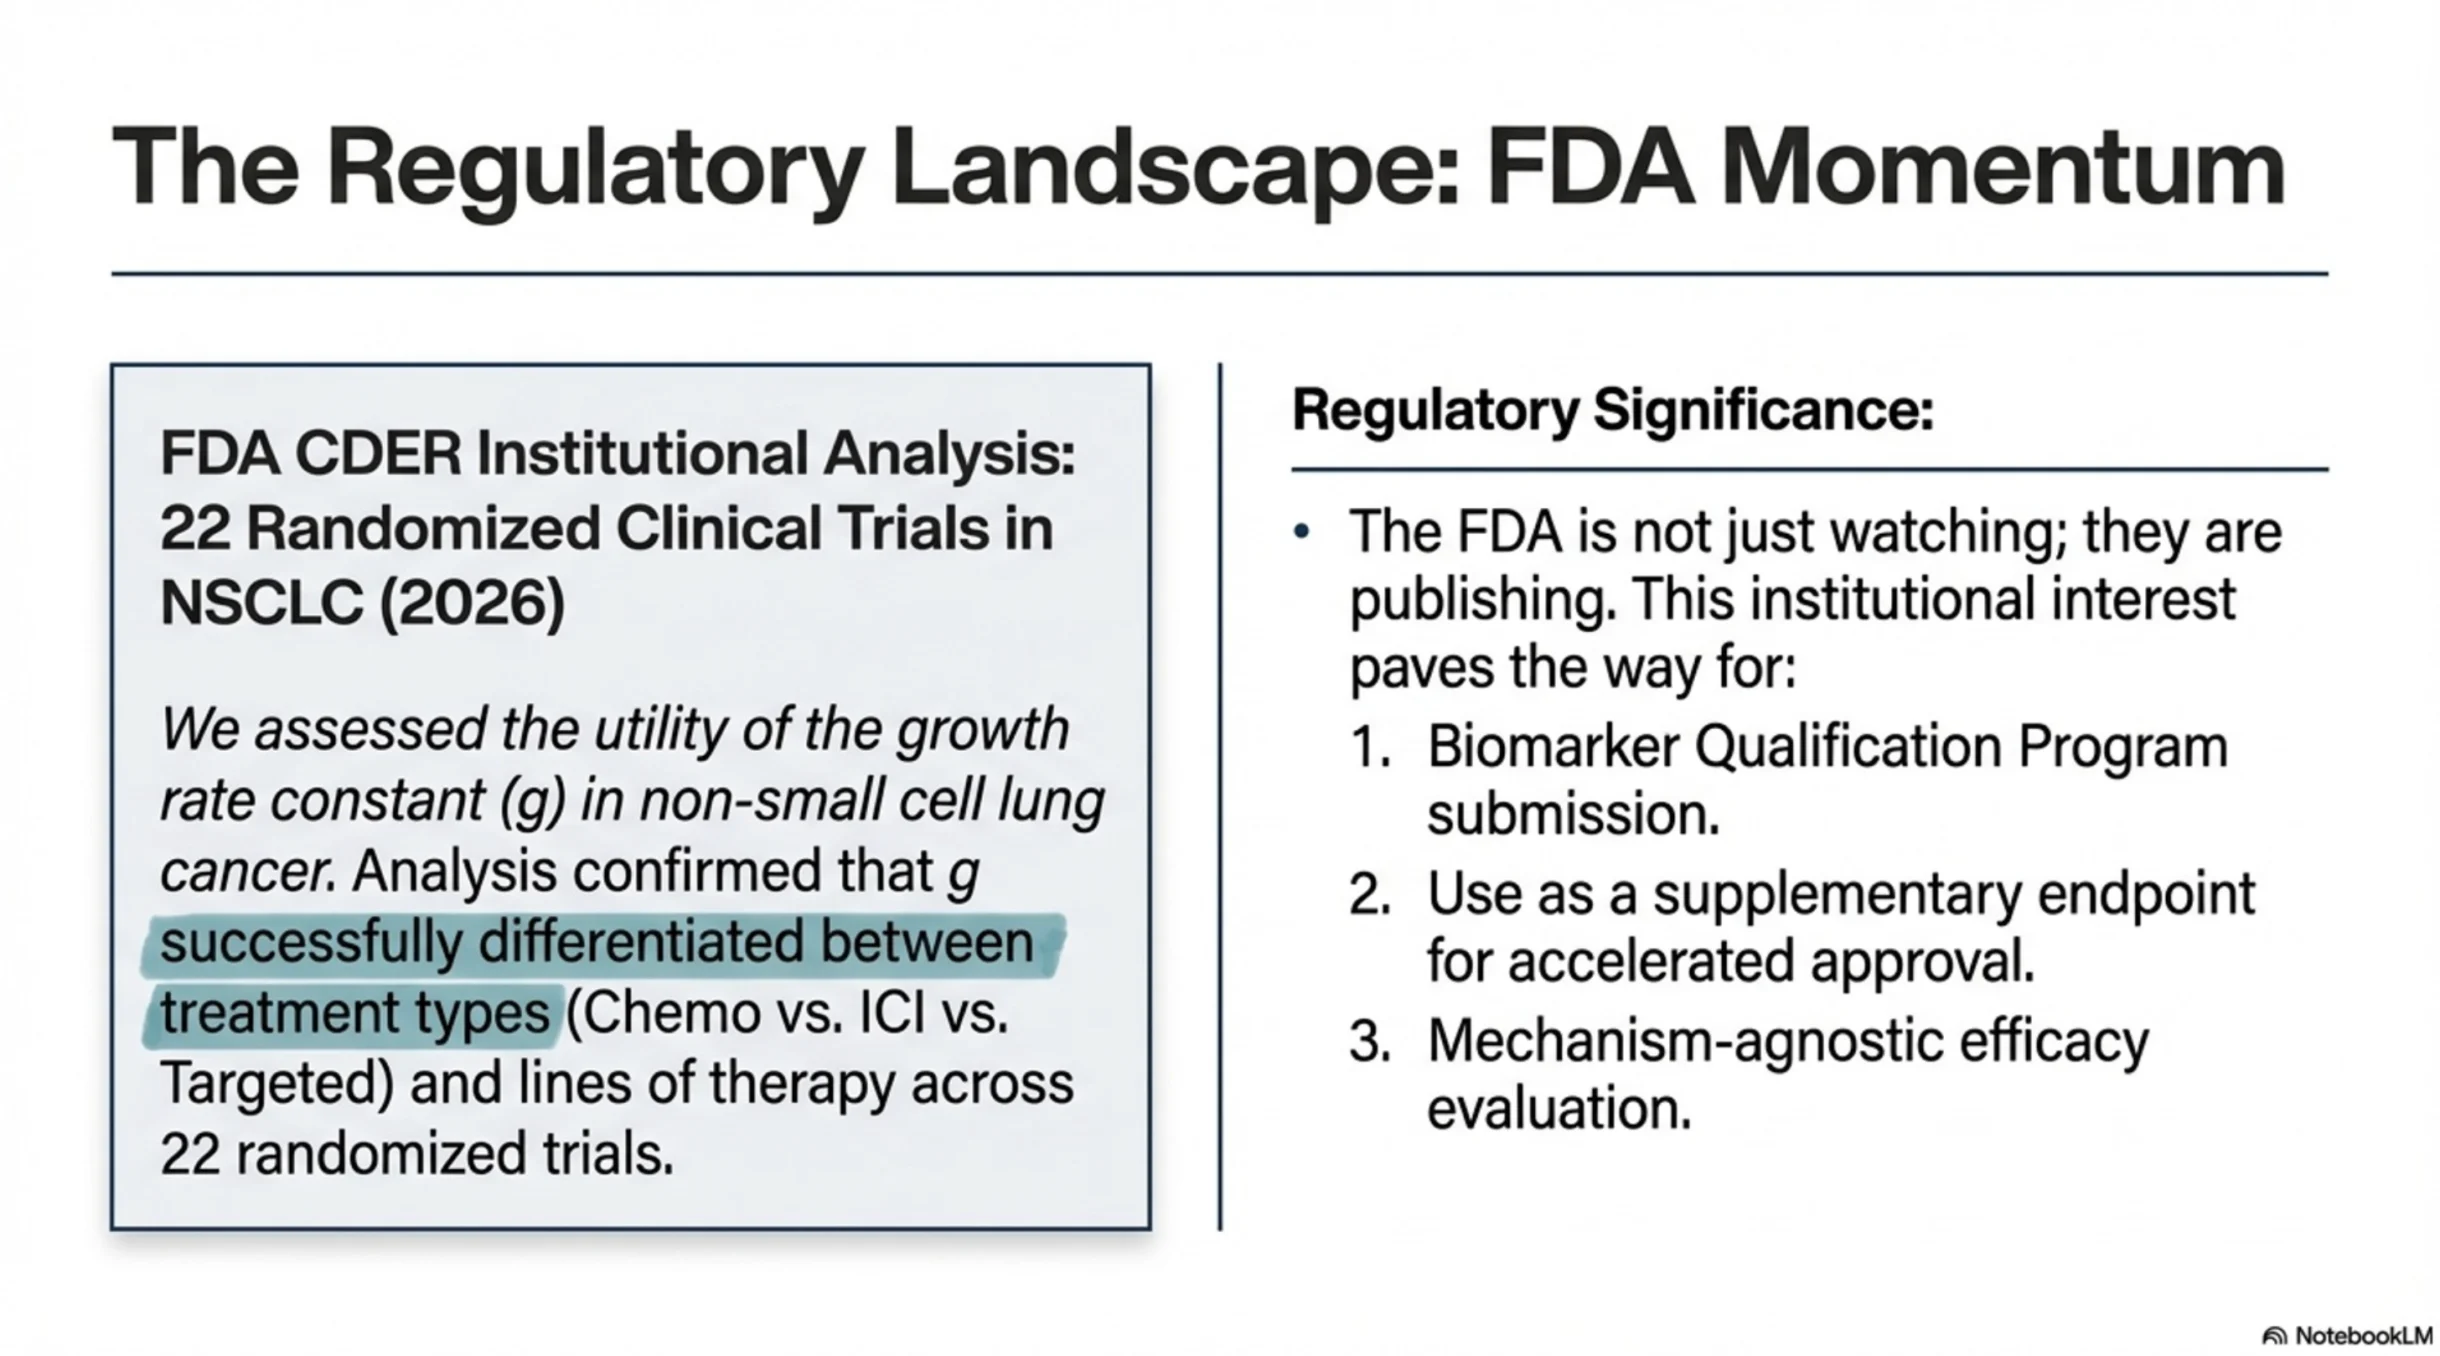
The FDA has just published an analysis applying tumor growth rate modeling (the ‘g value’) across 22 NSCLC trials and more than 13,000 patients (Malinou et al, 2026). This work builds on ~15 years of research across prostate, renal cell, colorectal, pancreatic cancer, and now lung cancer.
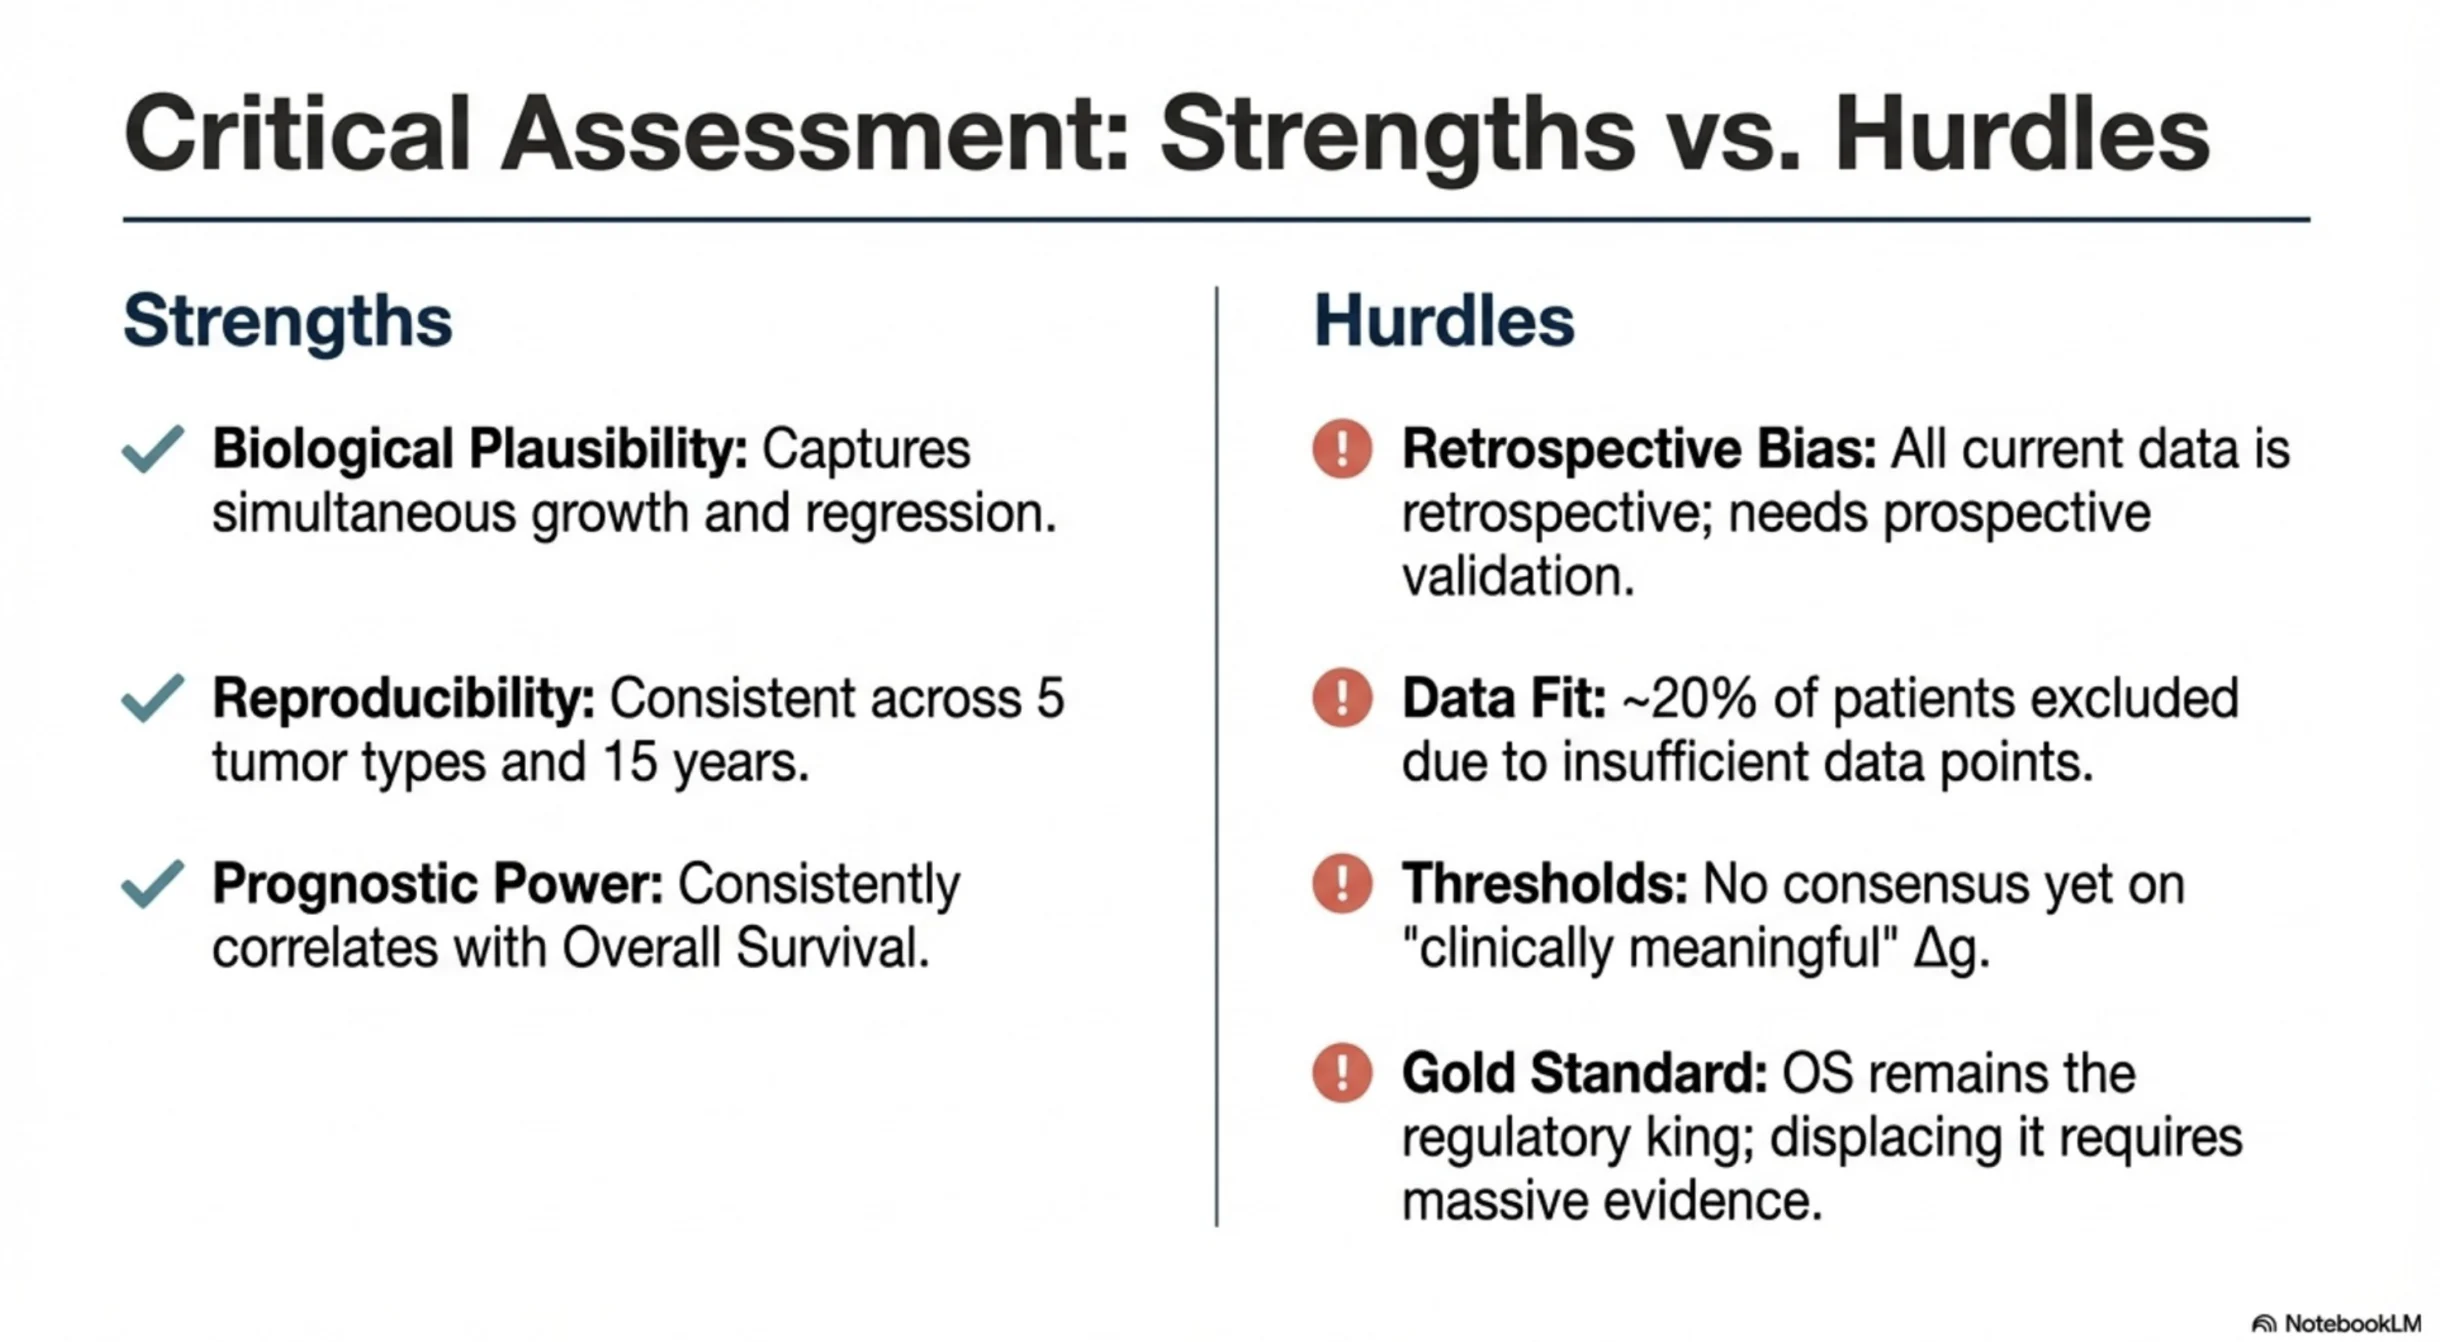
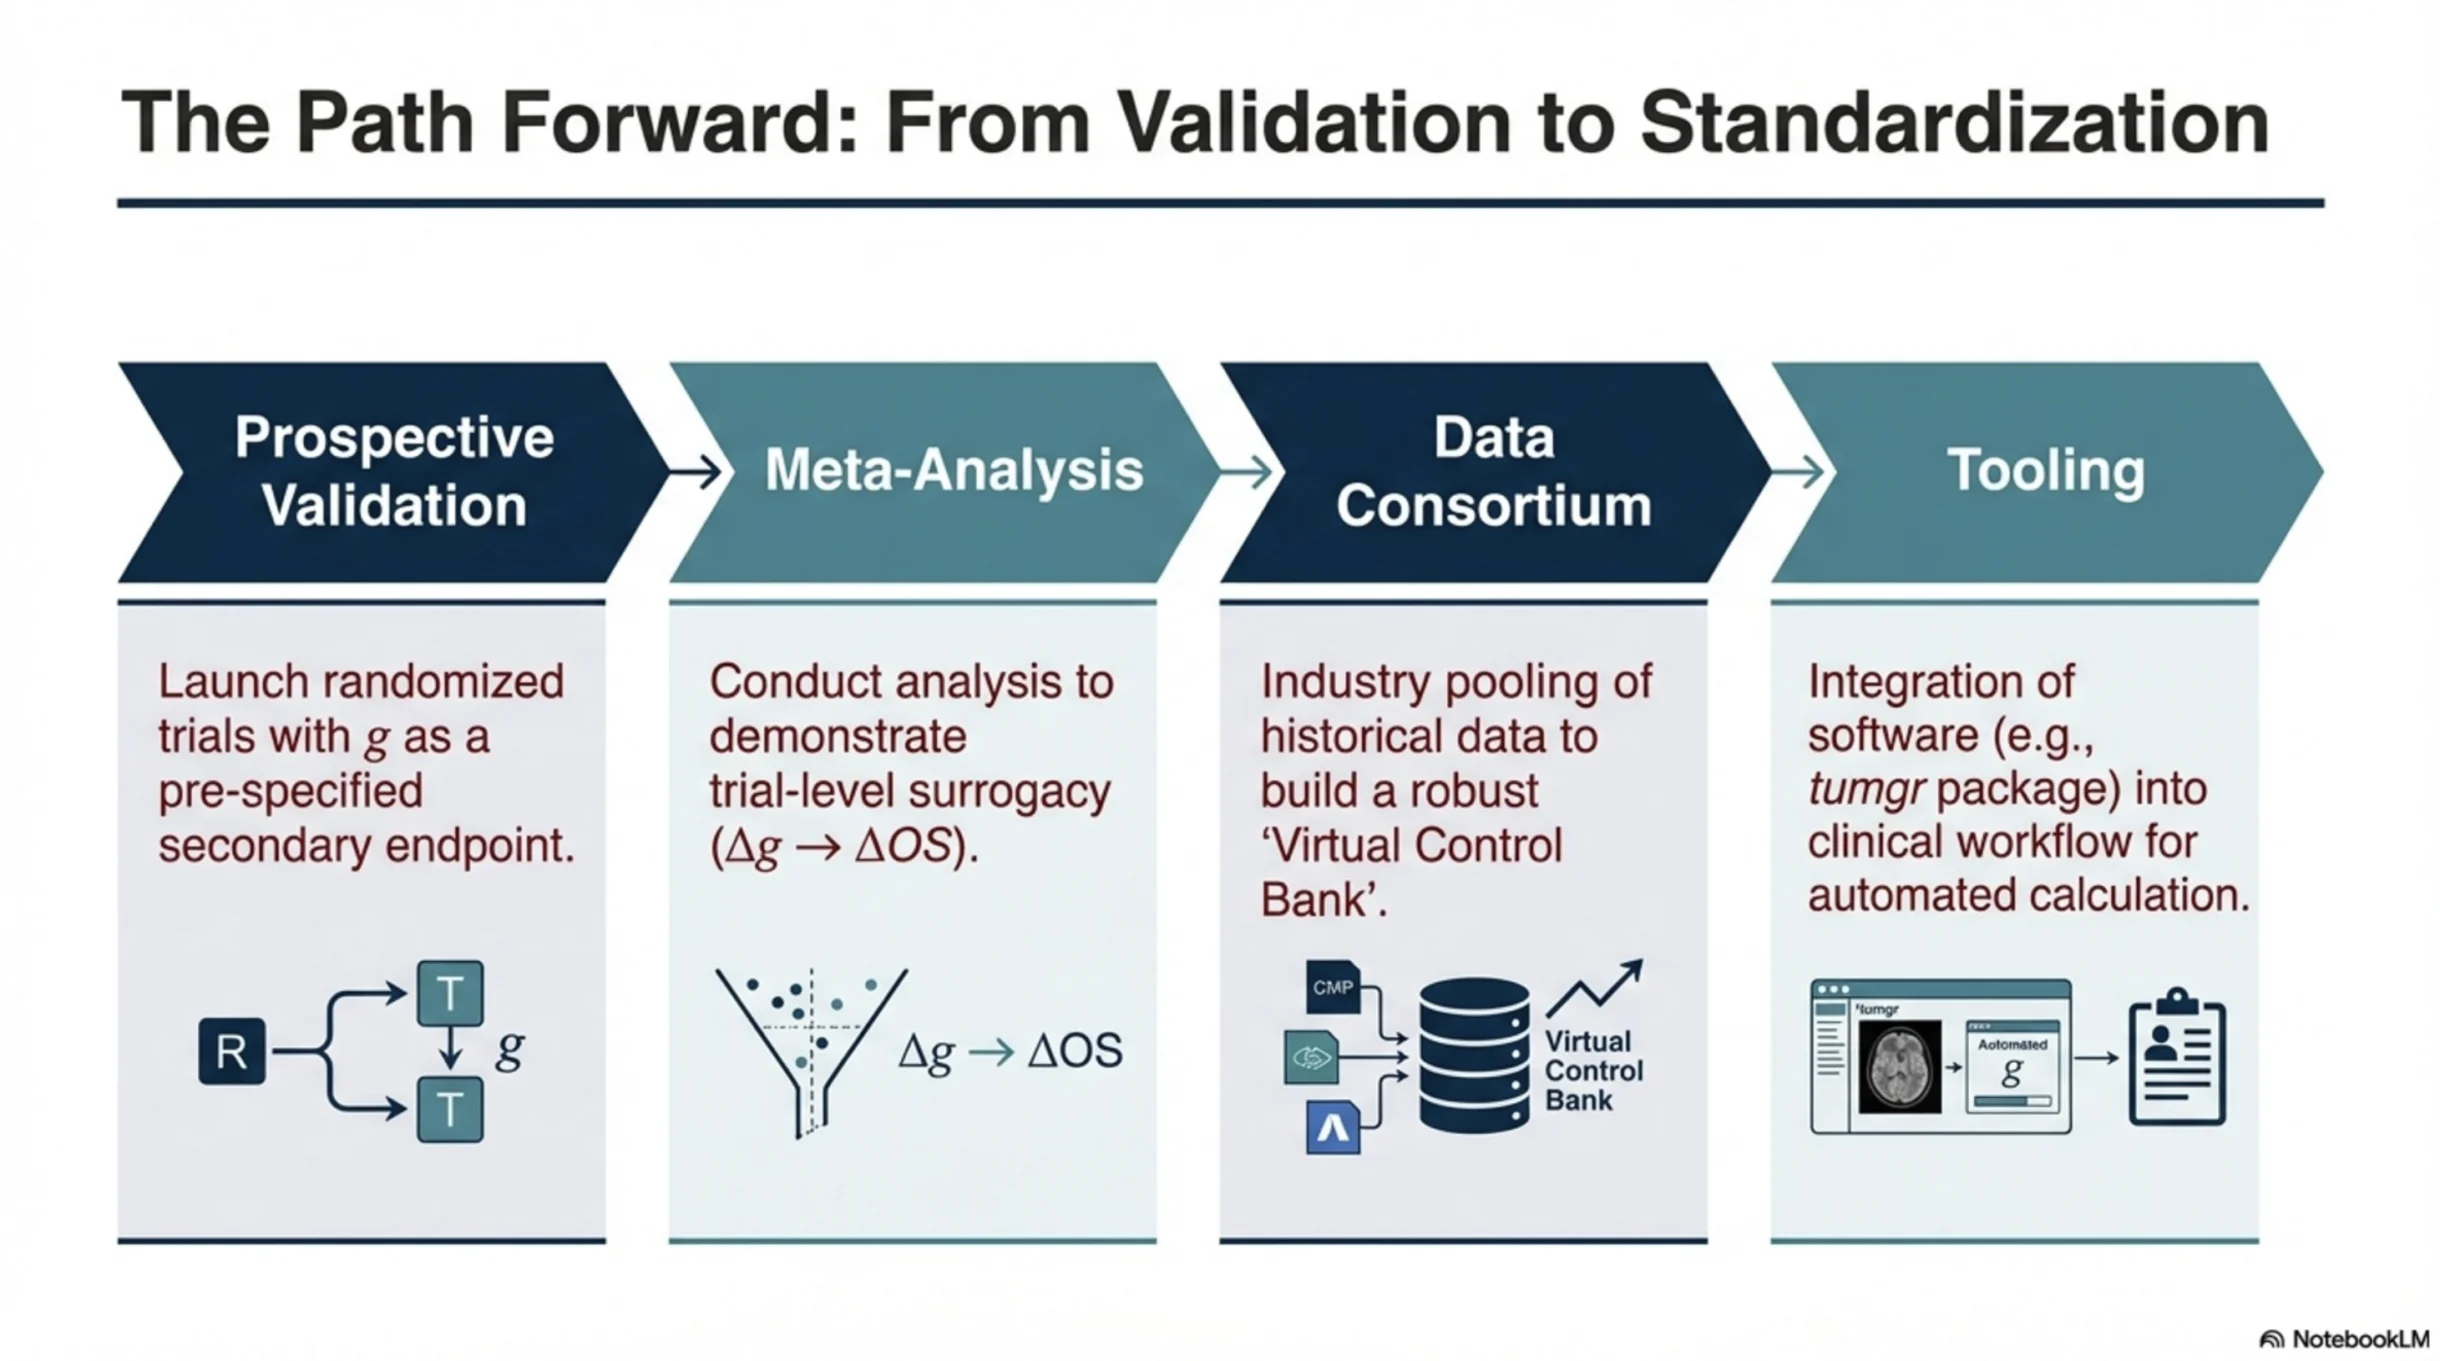
If validated prospectively — and if we can define what a clinically meaningful change in g looks like — this metric has the potential to be transformative for a few reasons:
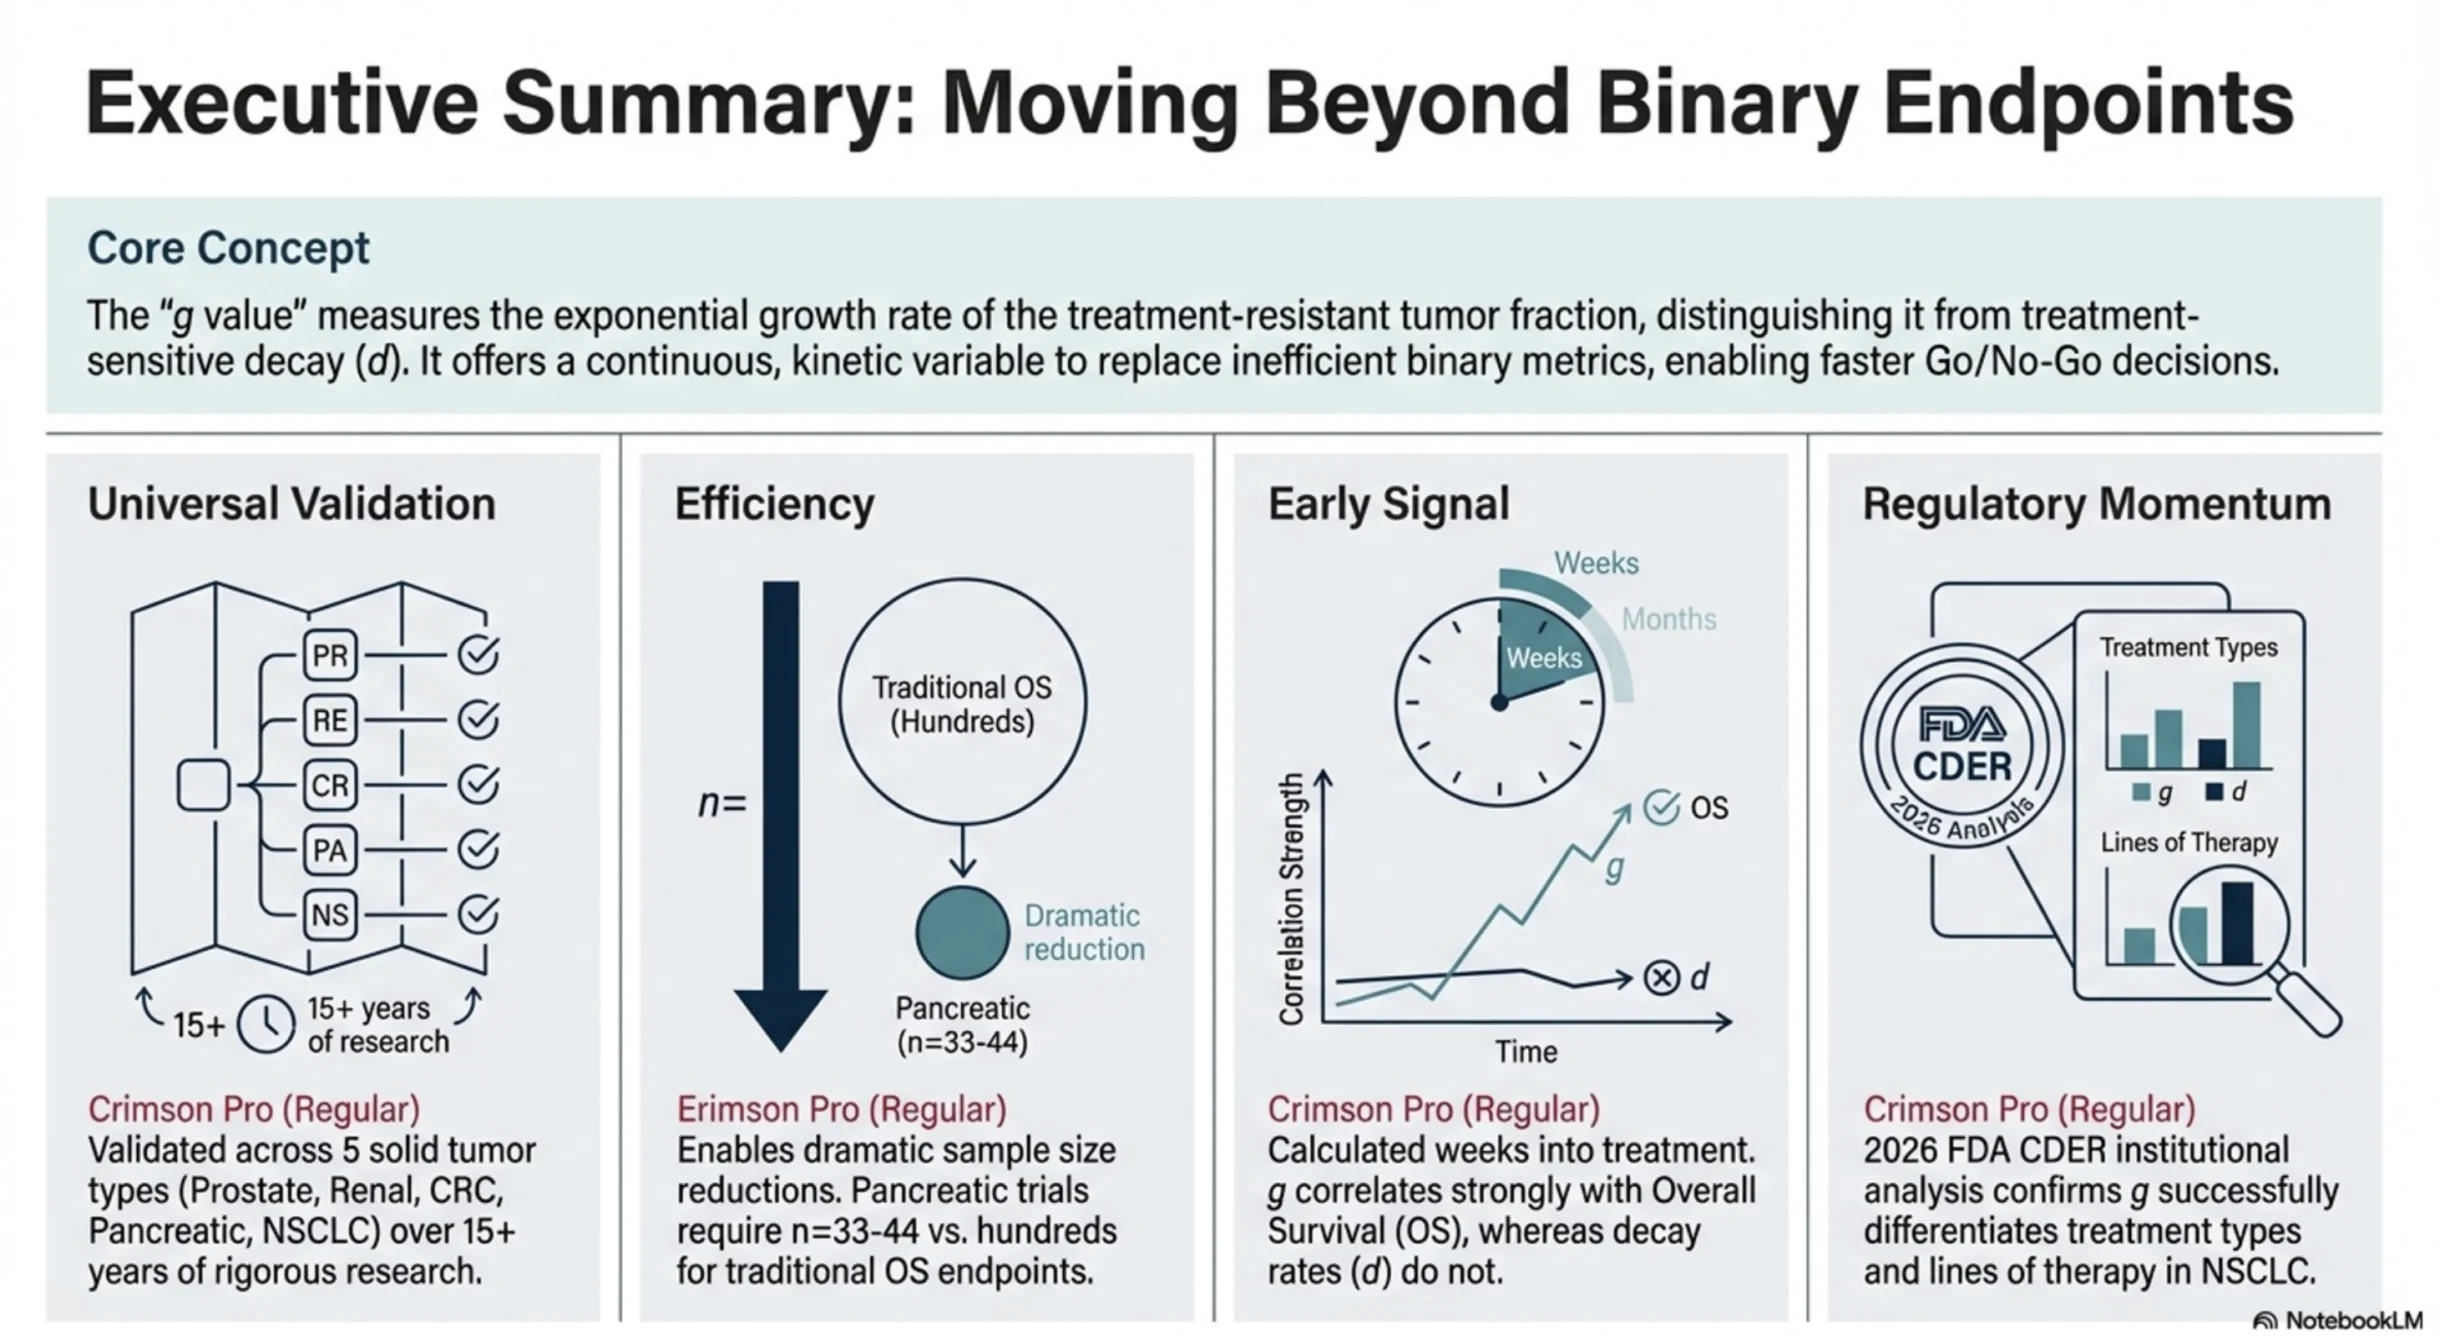
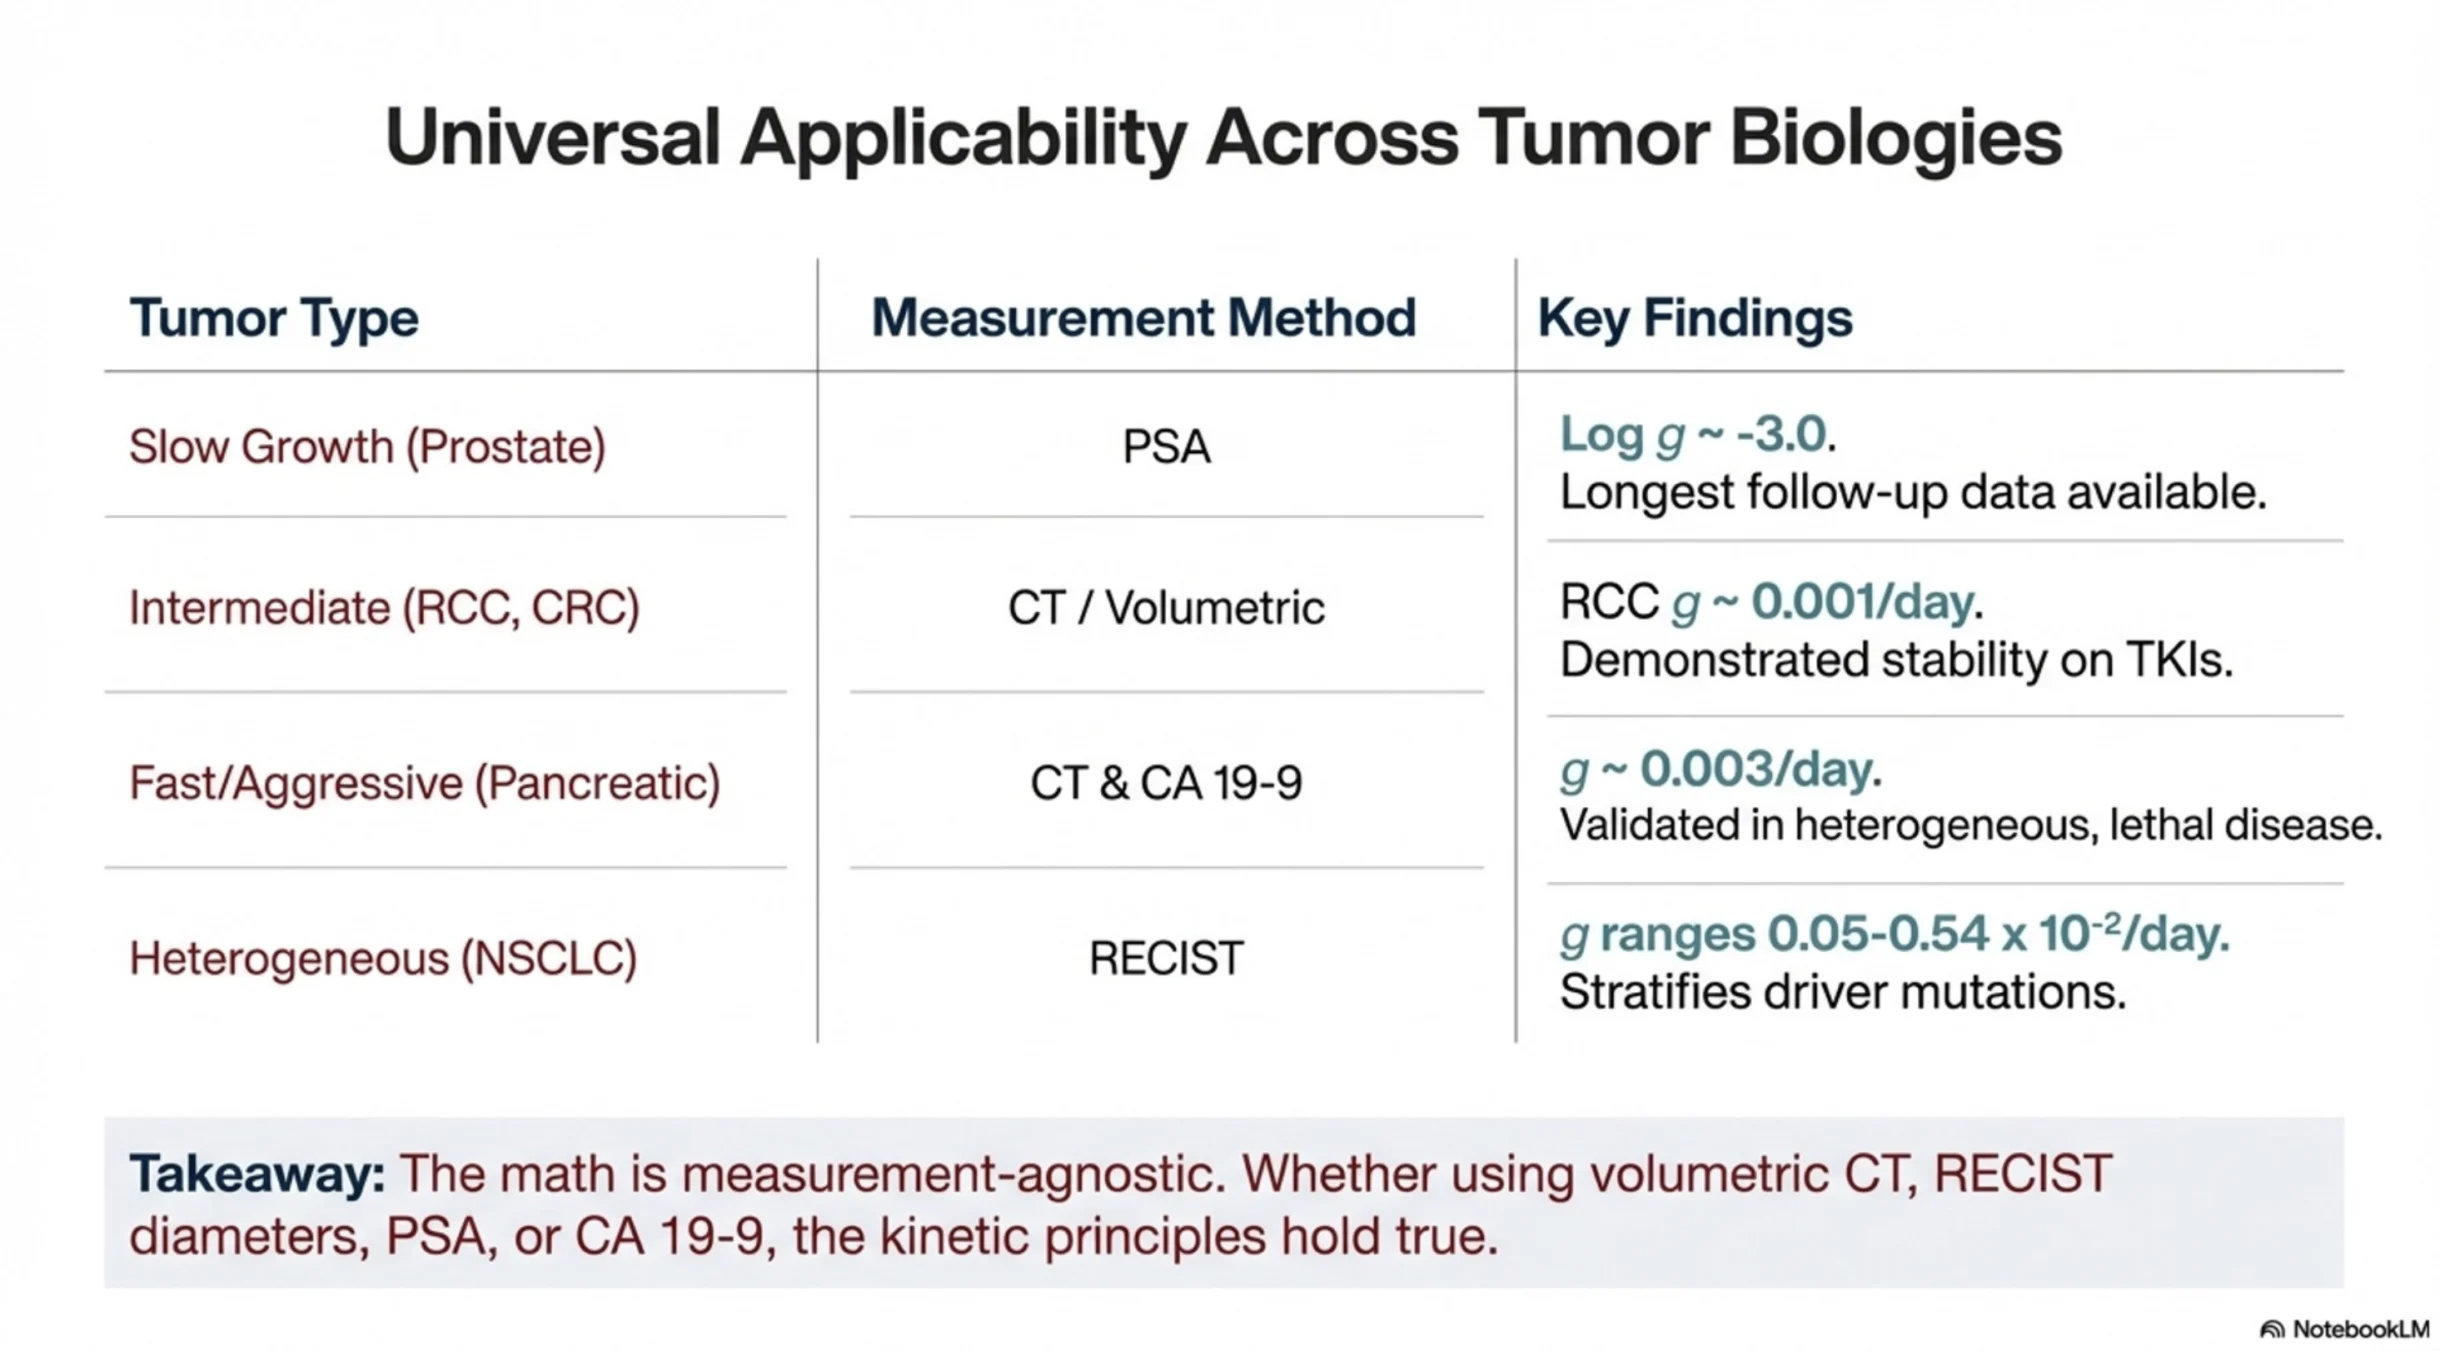
1. A universal way to think about treatment effect. For the first time, we have a continuous measure that can be compared across therapies, mechanisms of action, and lines of treatment — and potentially even across solid tumors.
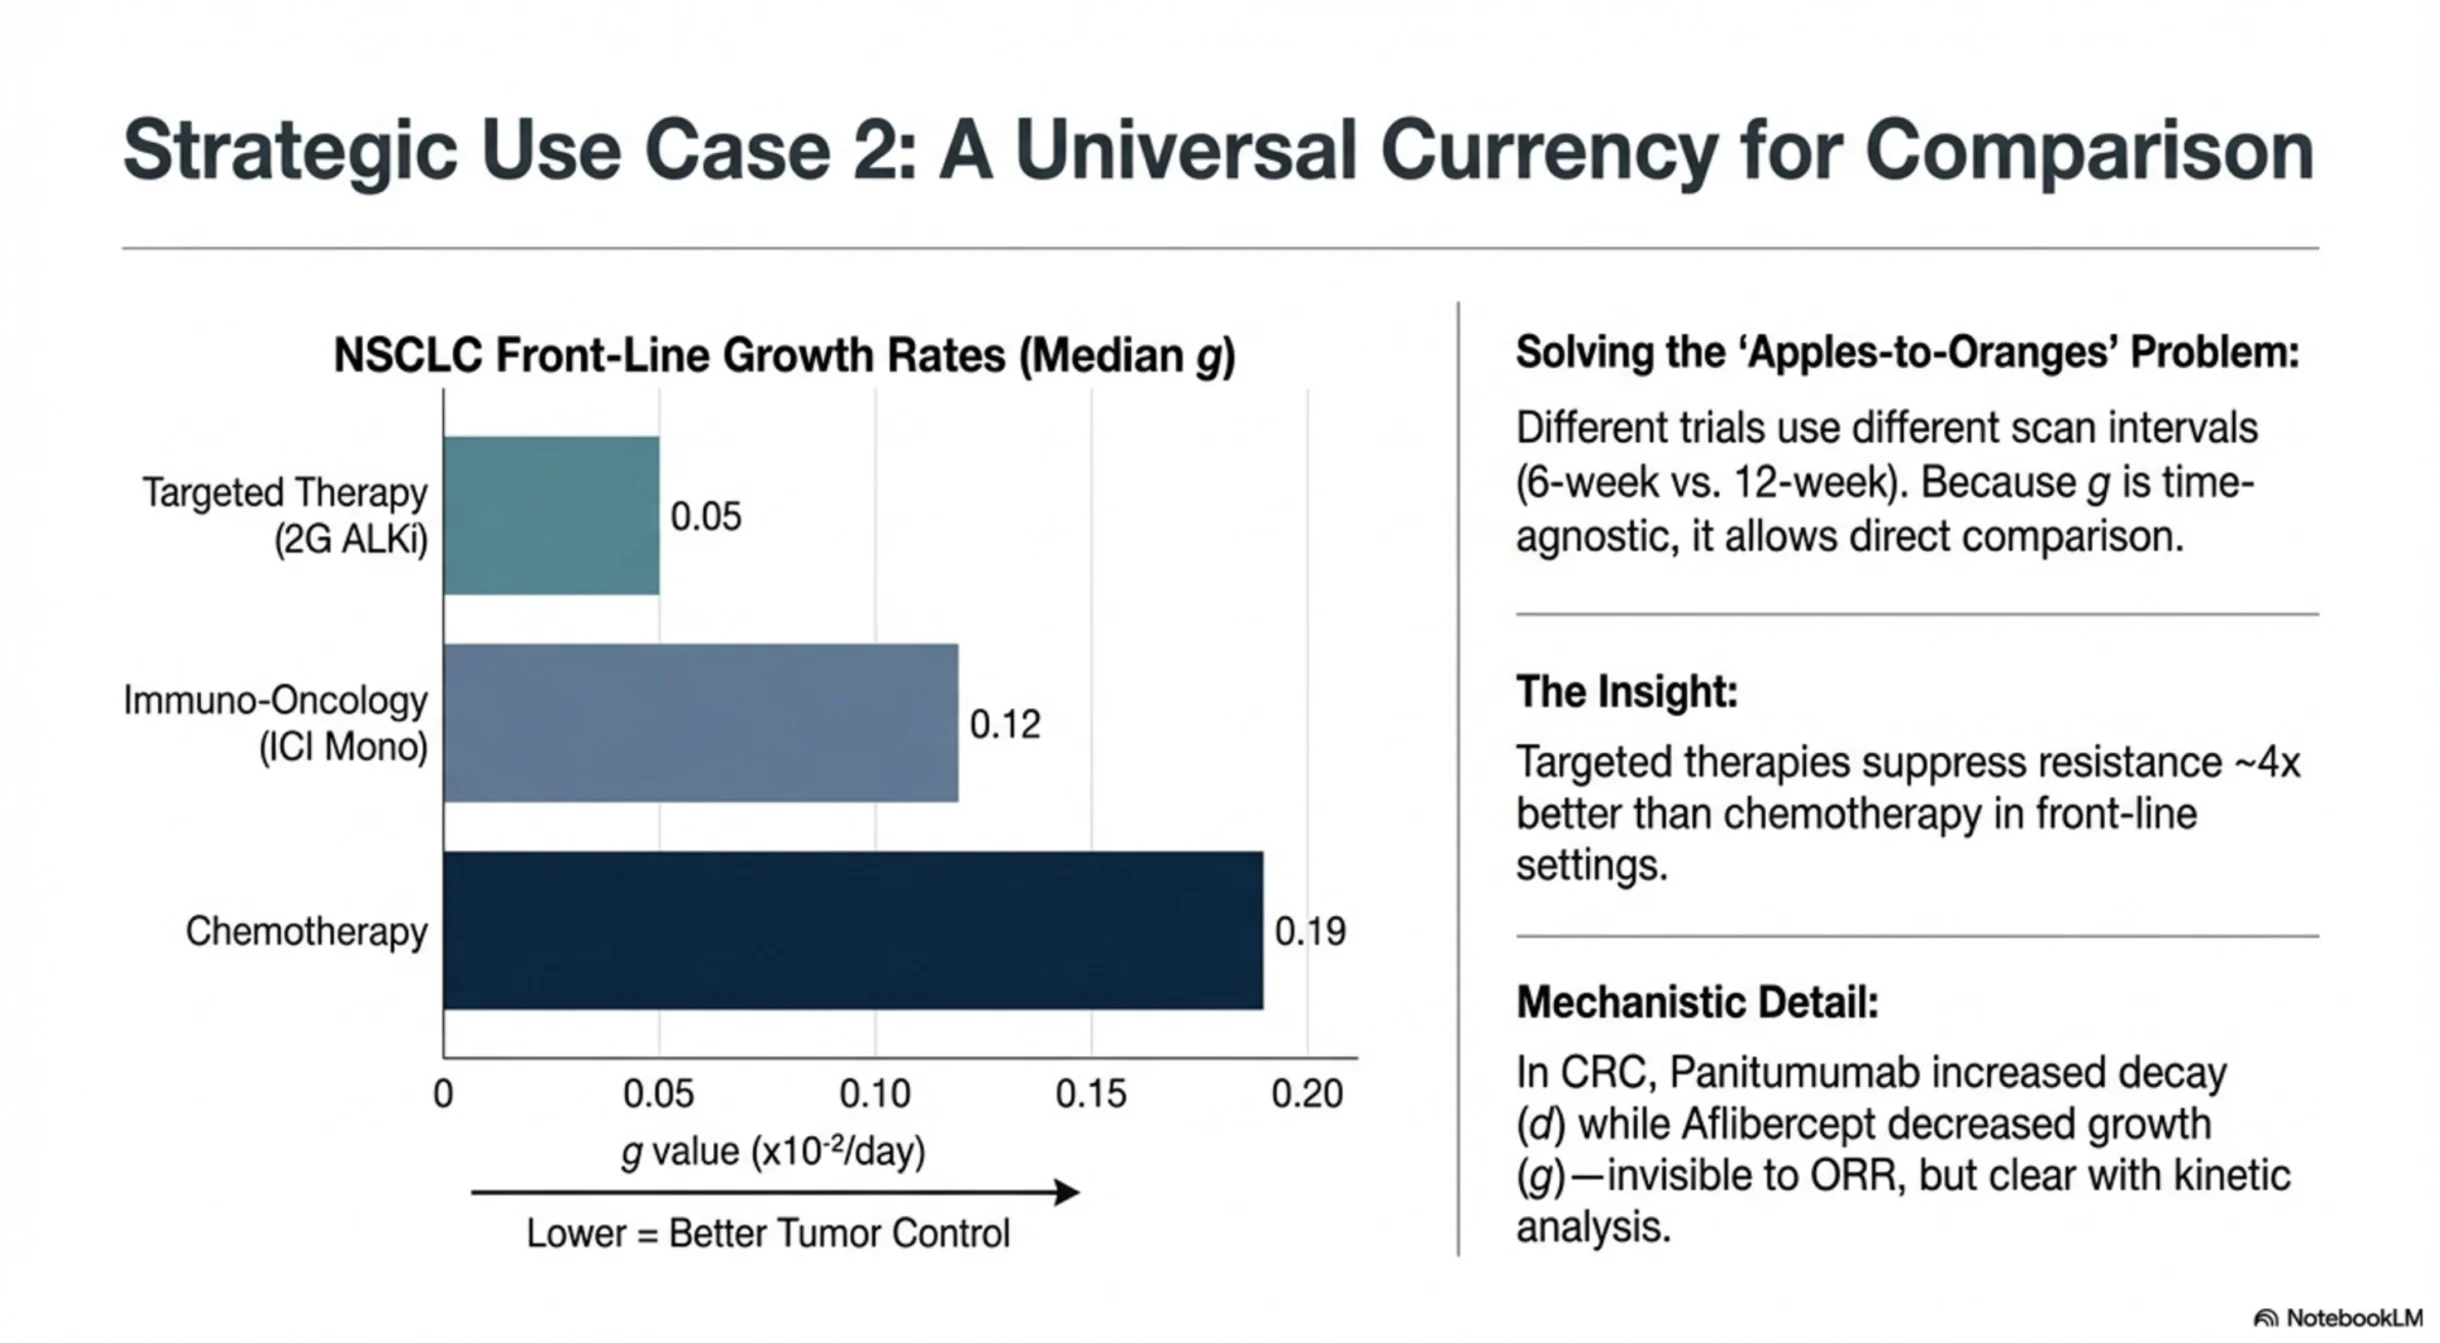
In 1L NSCLC, median g values look roughly like this:
- 2nd-gen ALK inhibitors: 0.05 ×10⁻²/day
- 3rd-gen EGFR inhibitors: 0.07 ×10⁻²/day
- ICI monotherapy: 0.12 ×10⁻²/day
- Chemotherapy: 0.19 ×10⁻²/day
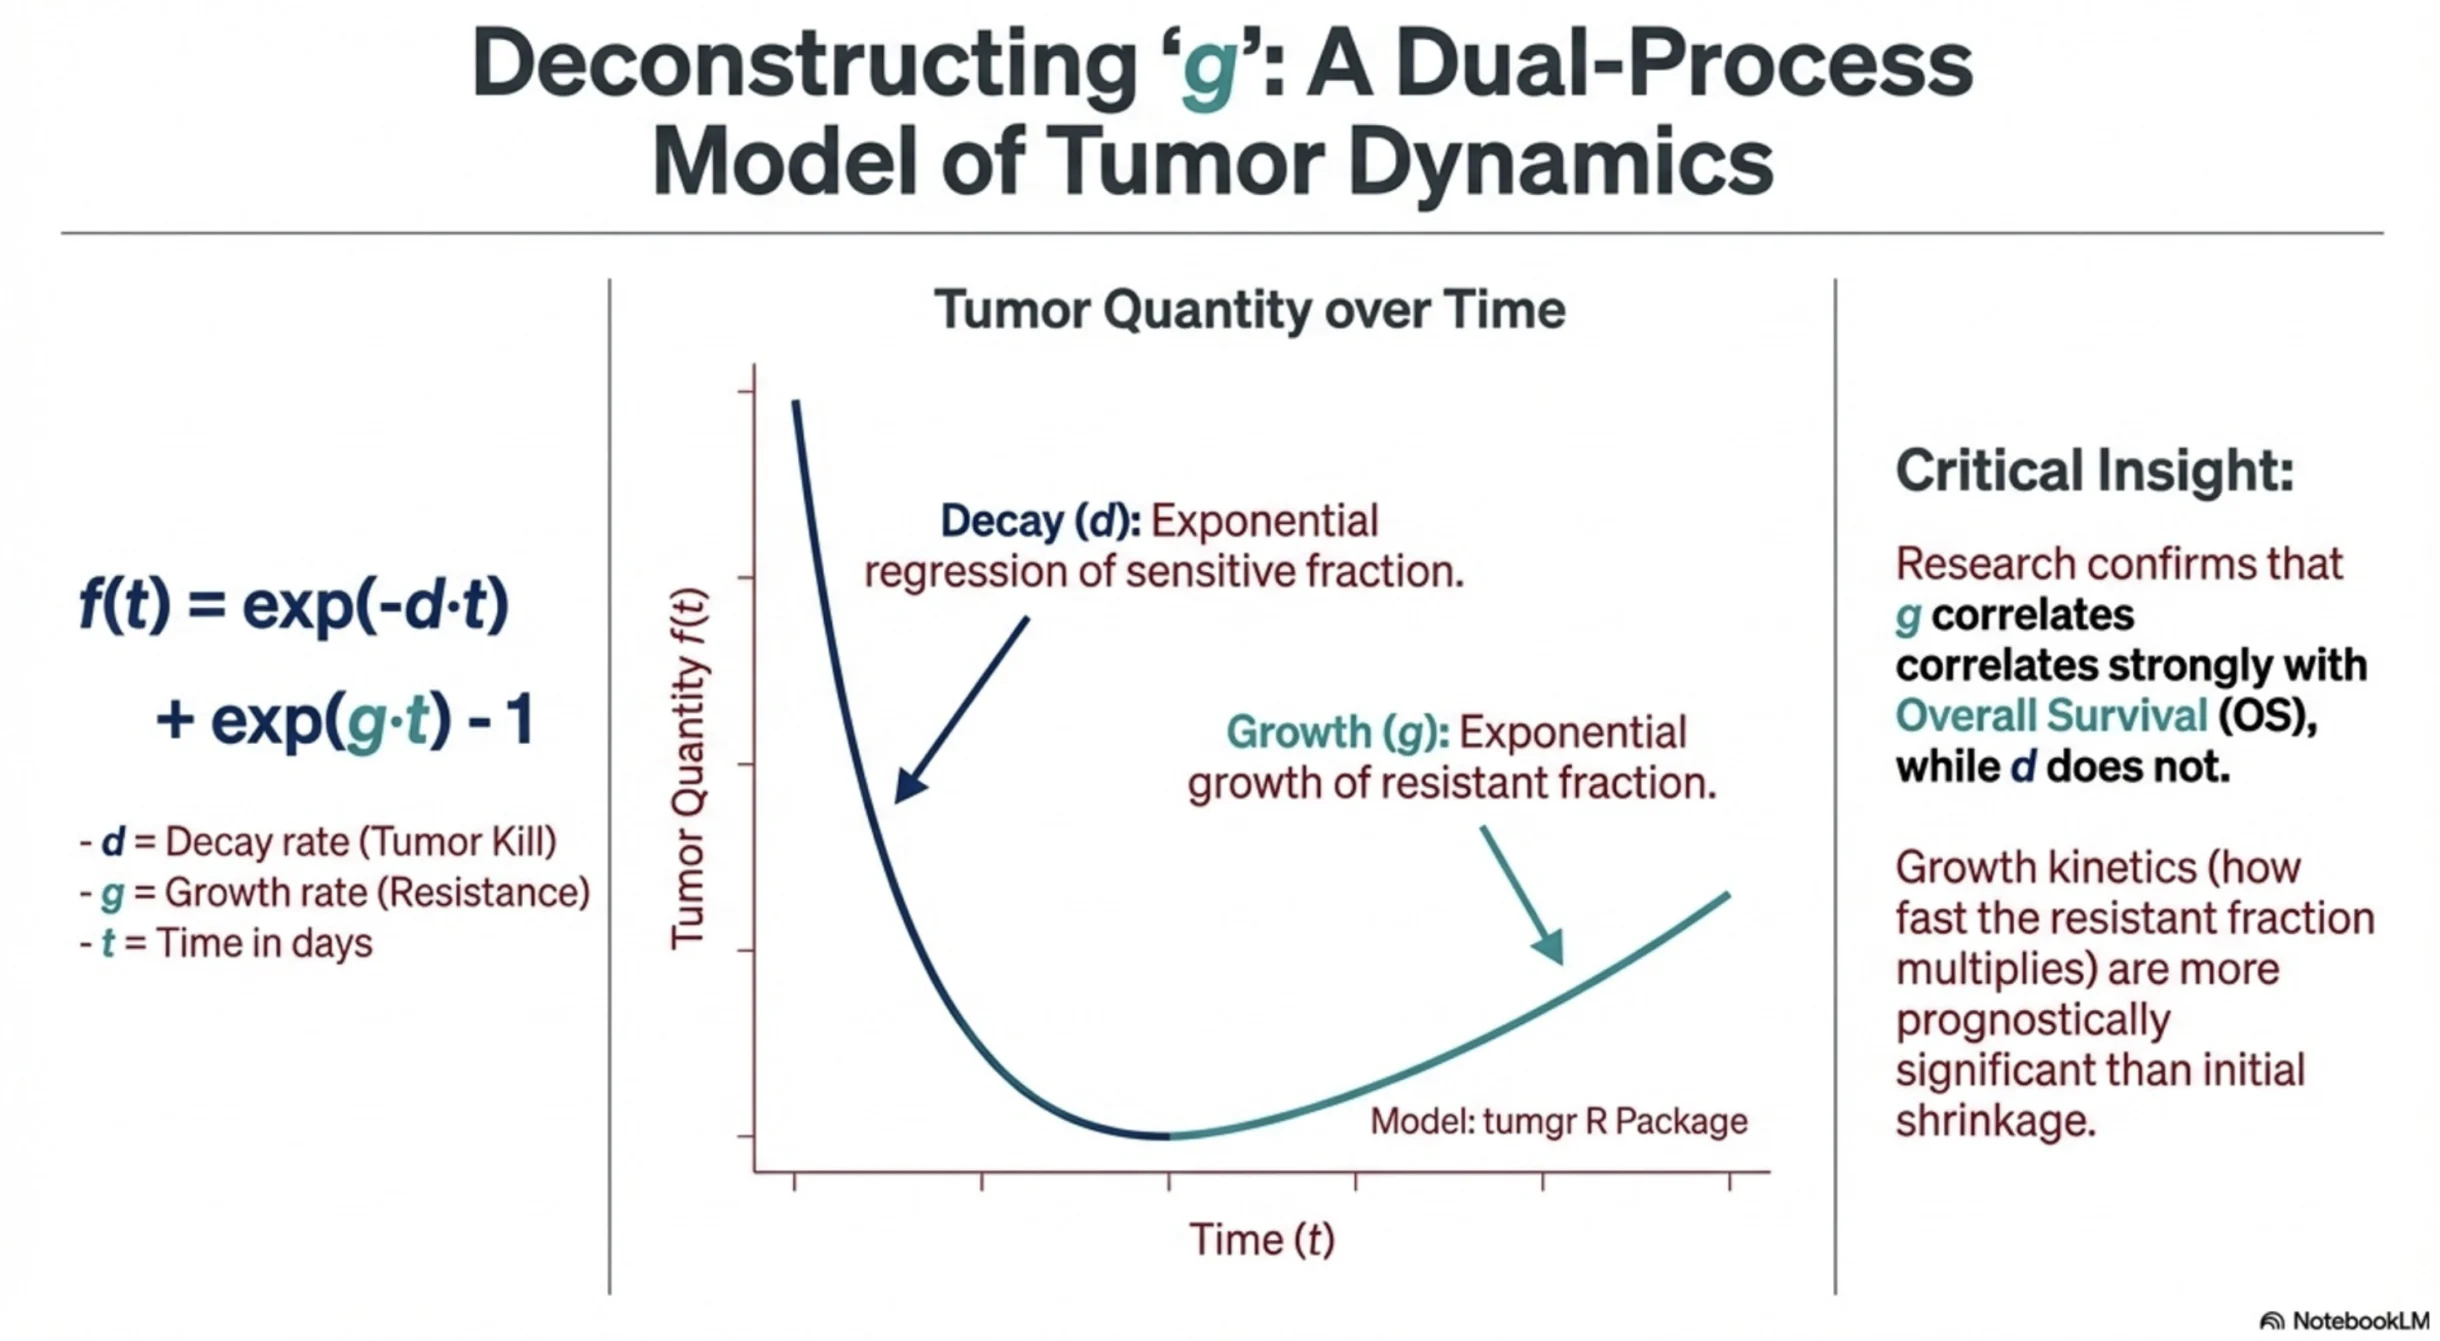
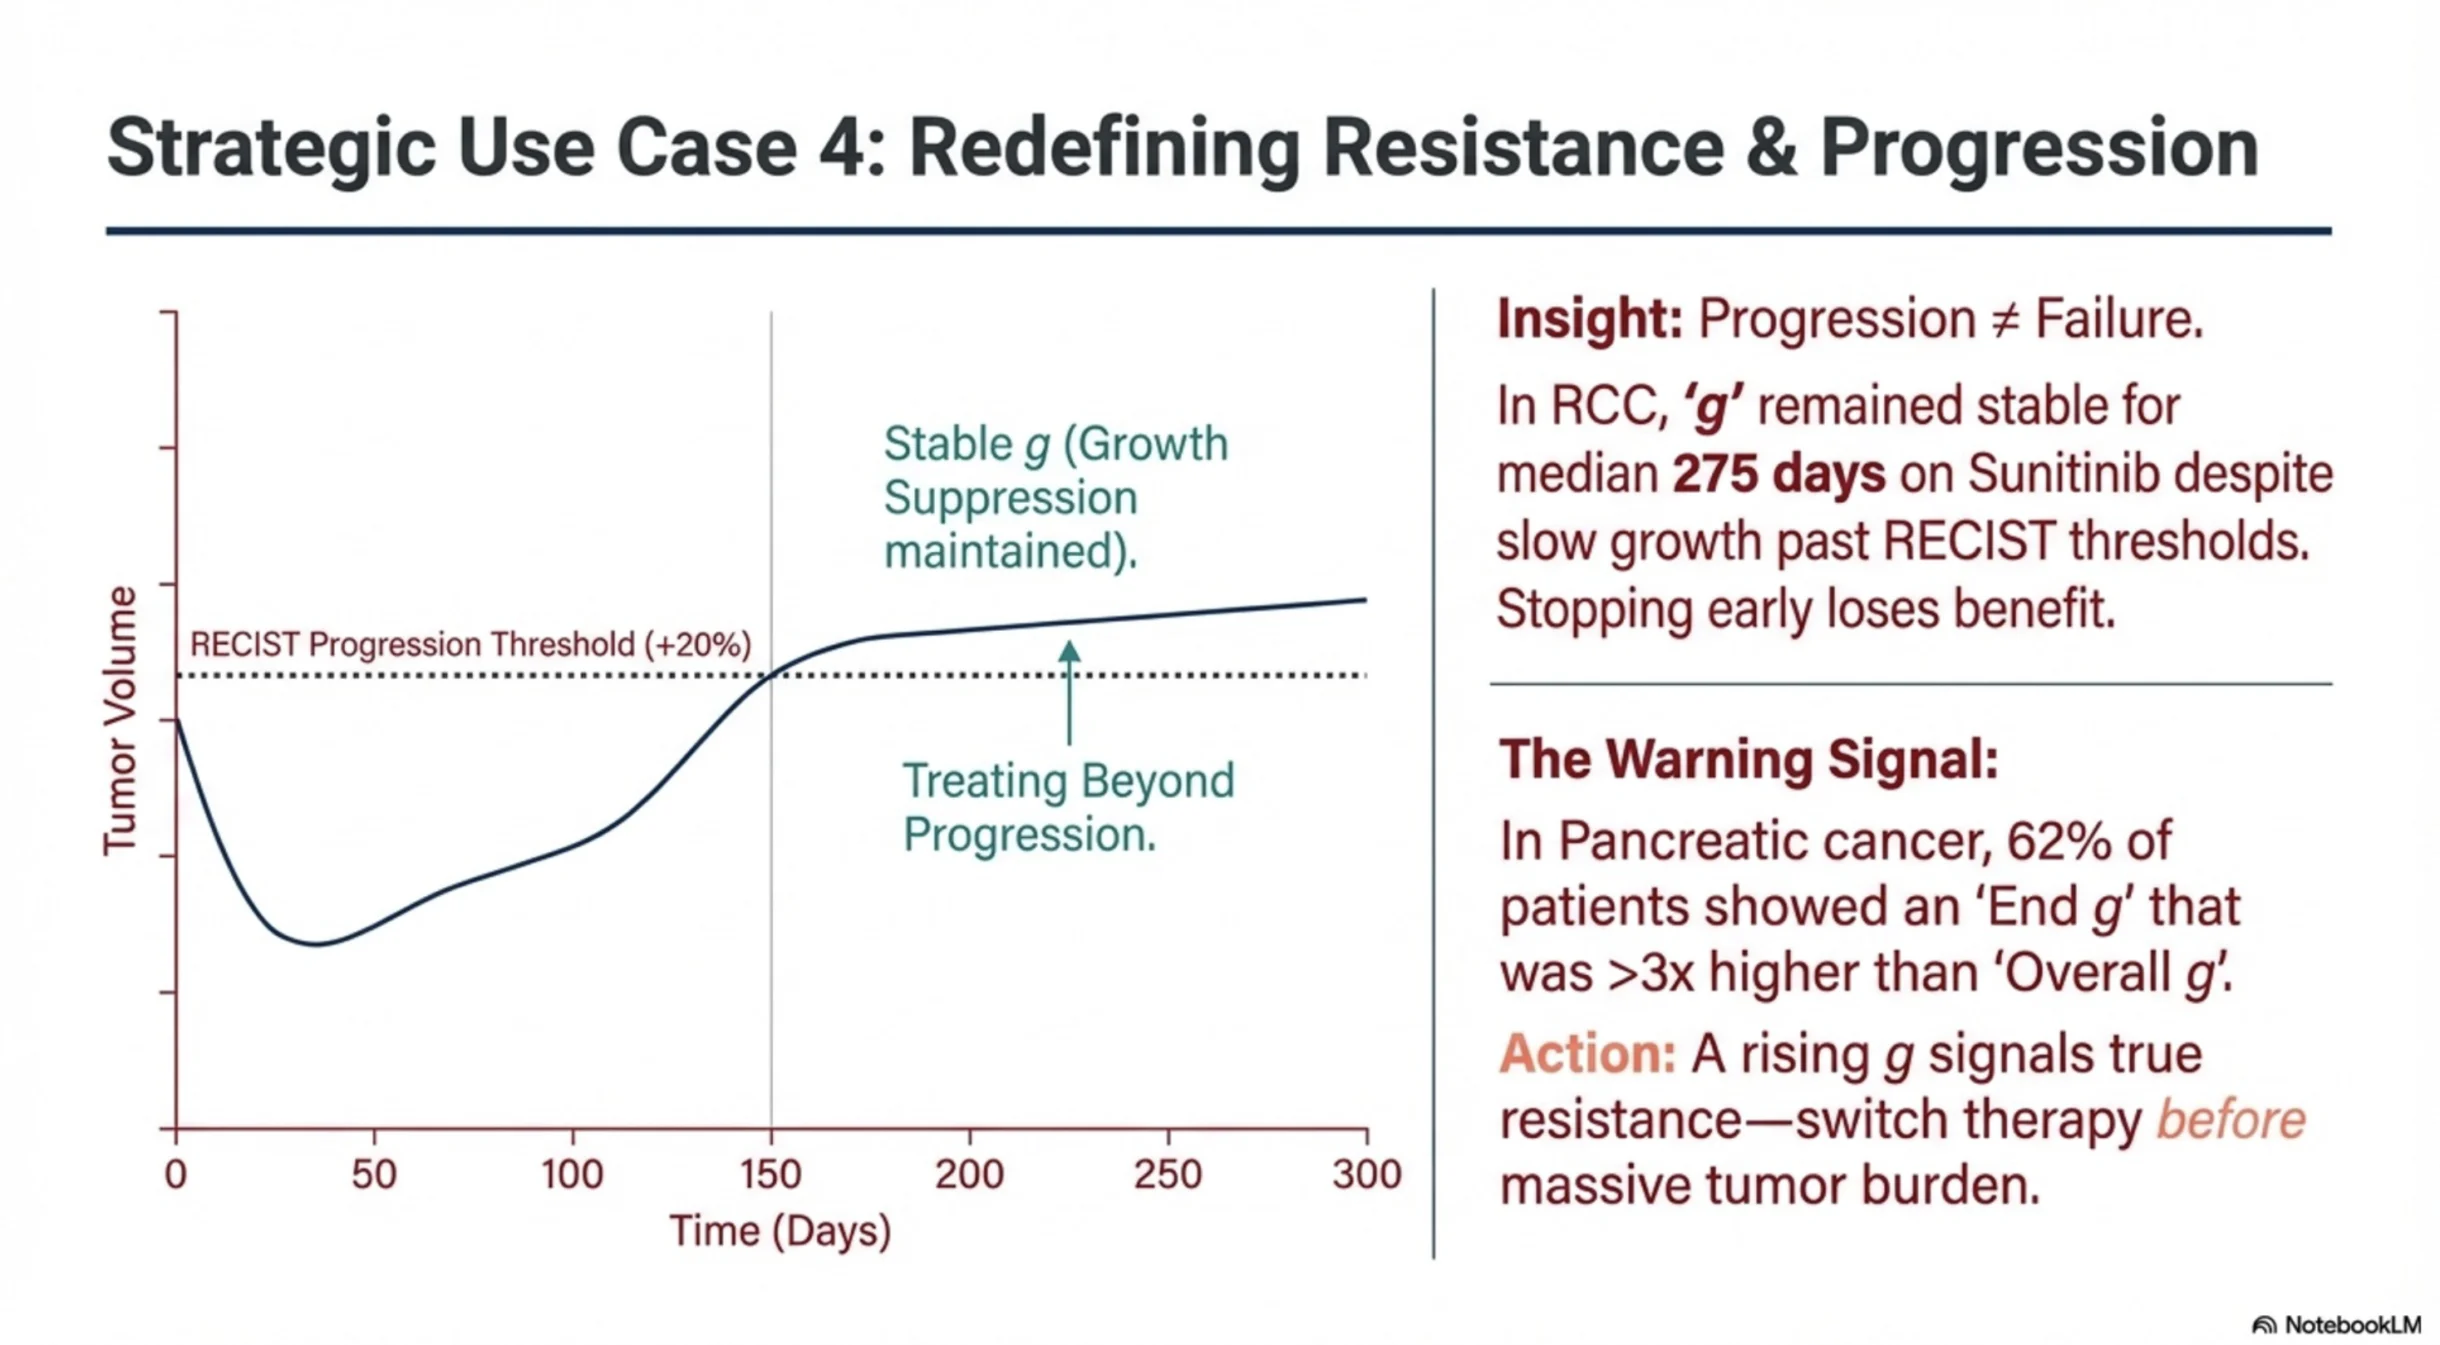
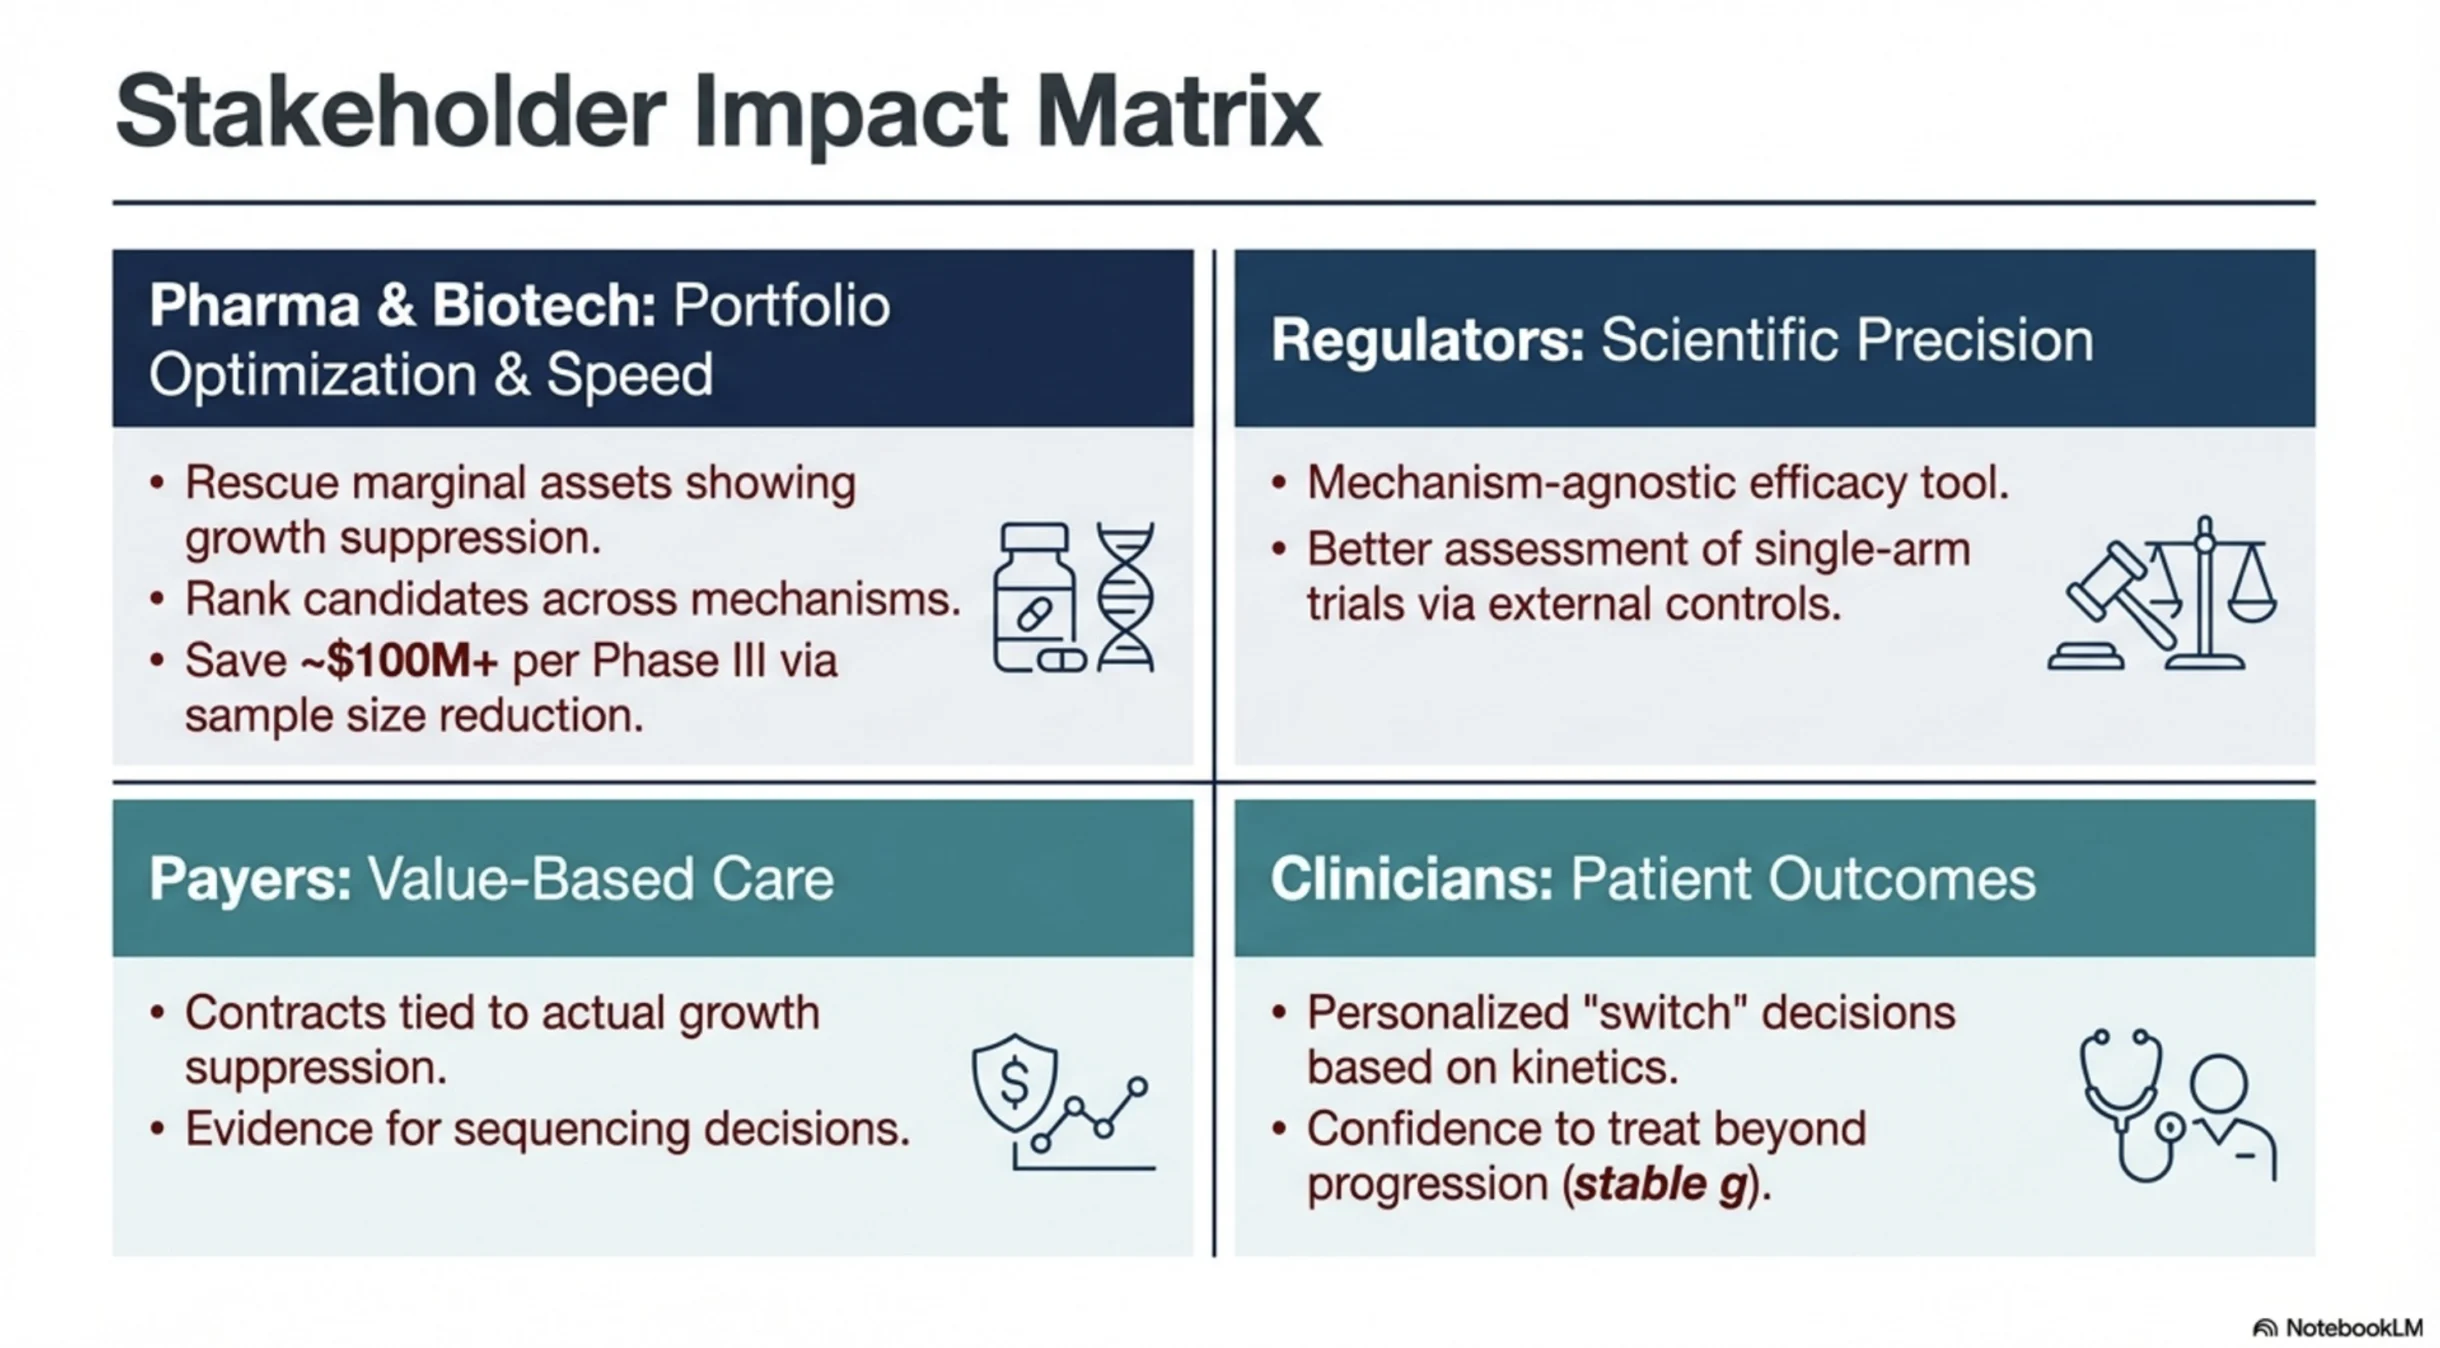
Lower g means slower tumor growth — better disease control. One metric that could help pharma teams prioritize portfolios, clinicians think about sequencing, regulators and payers assess value, and patients understand whether a treatment is truly holding disease in check.
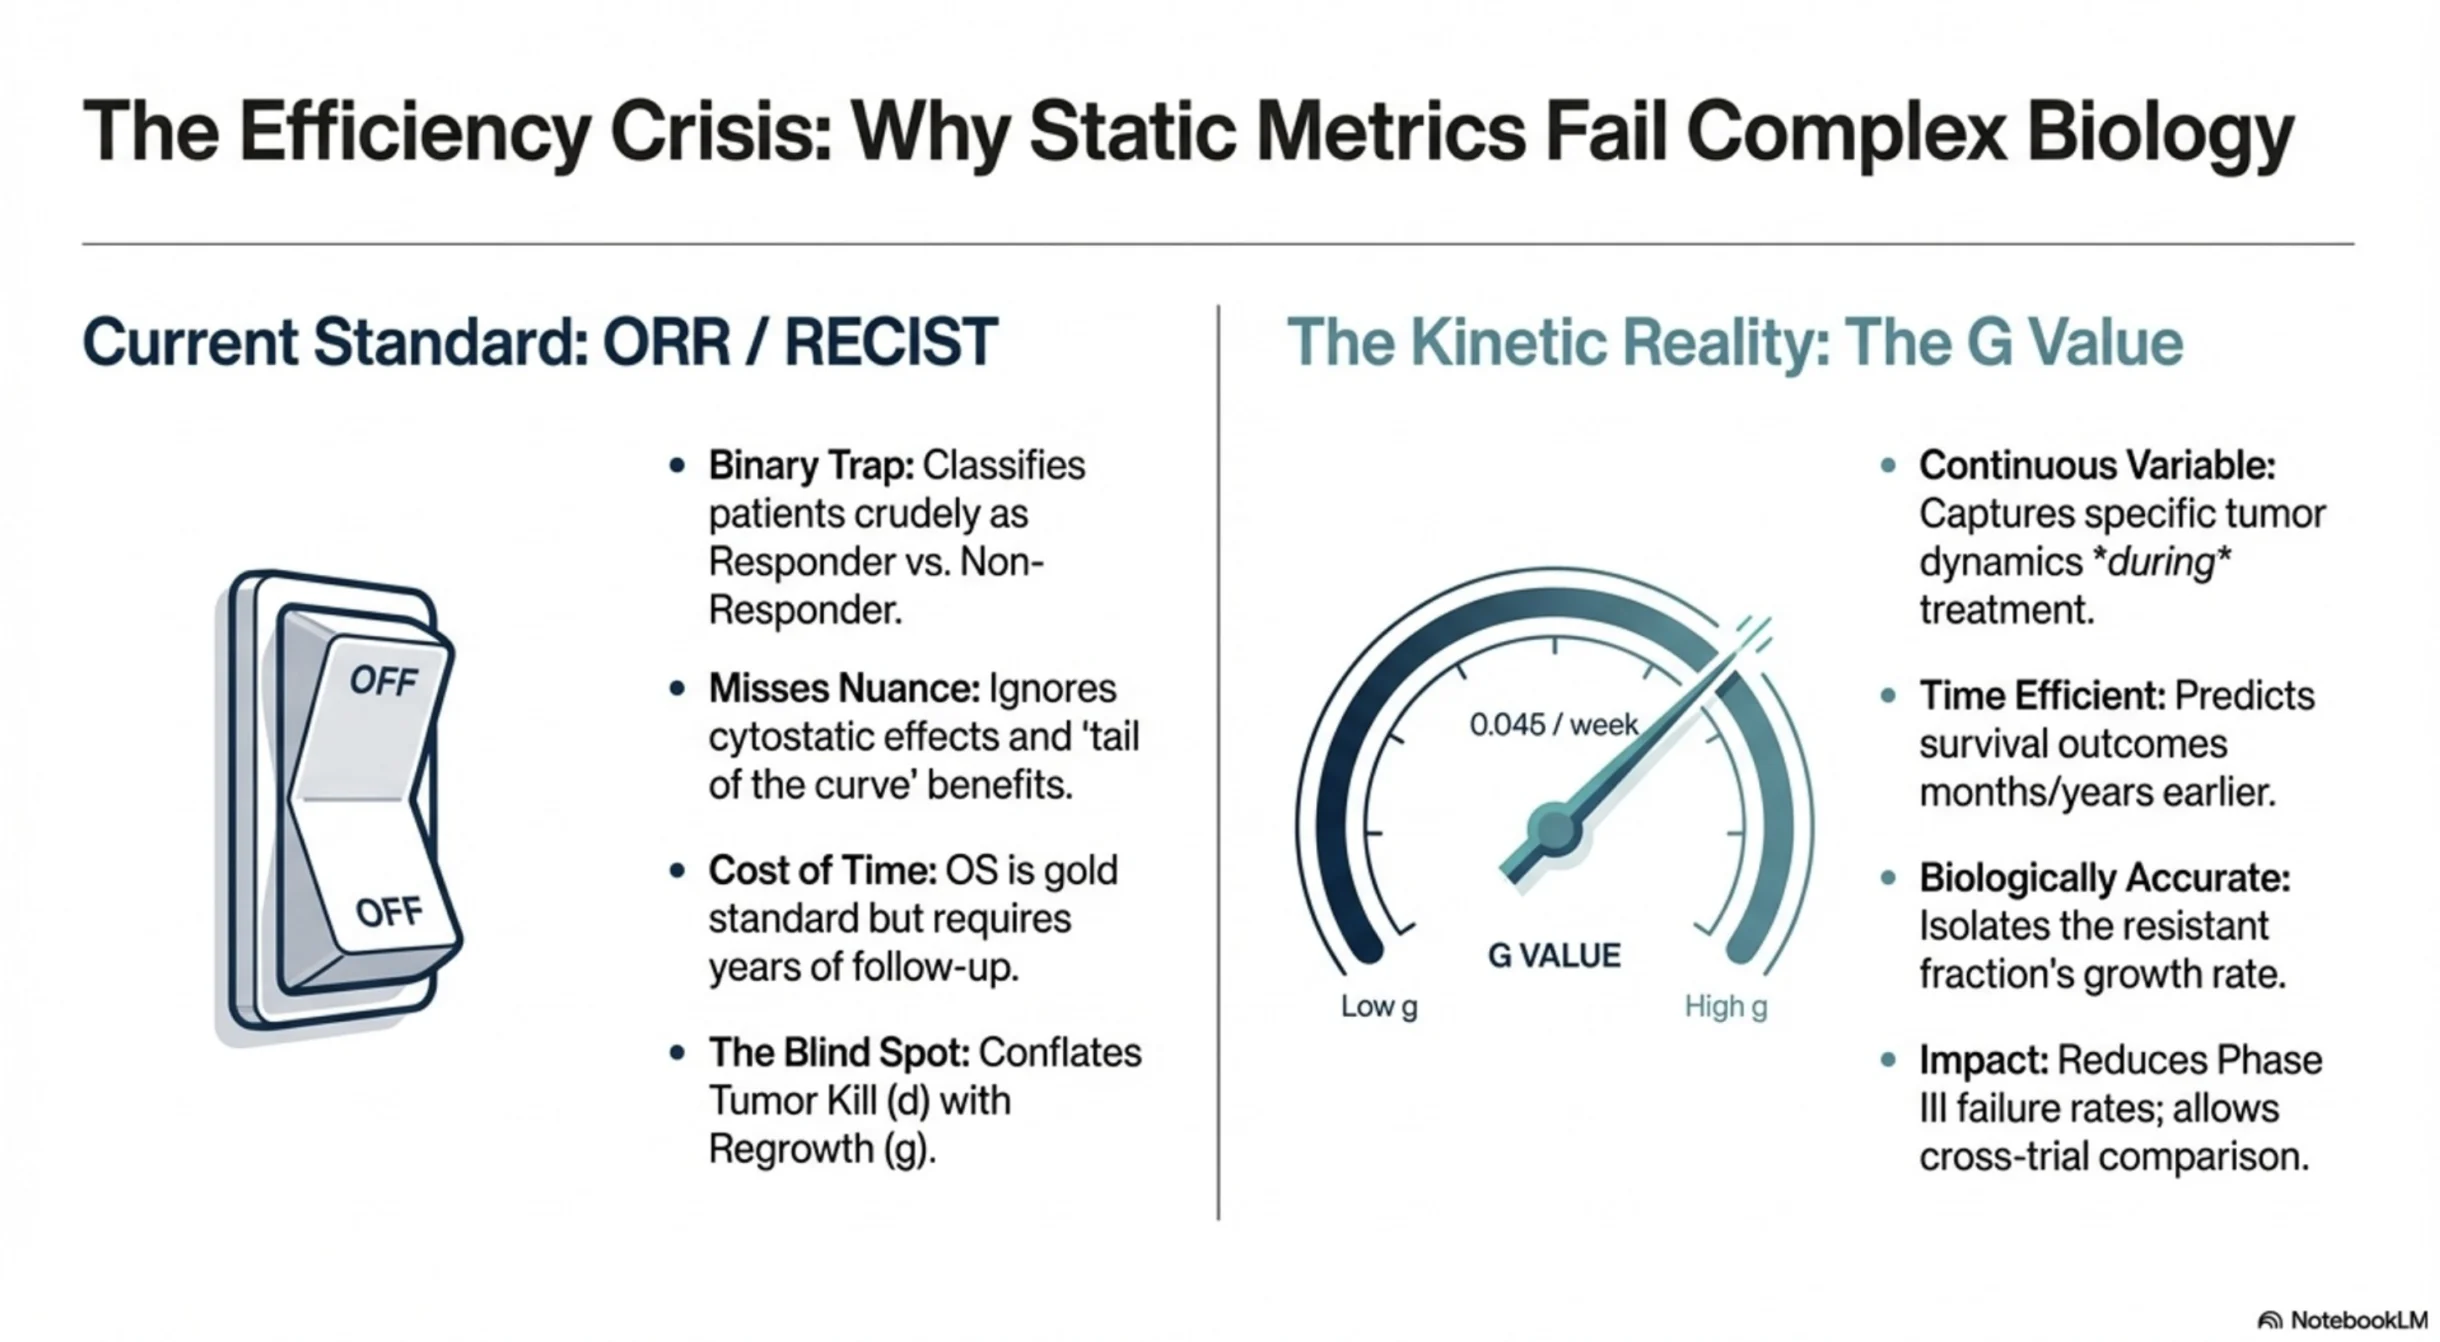
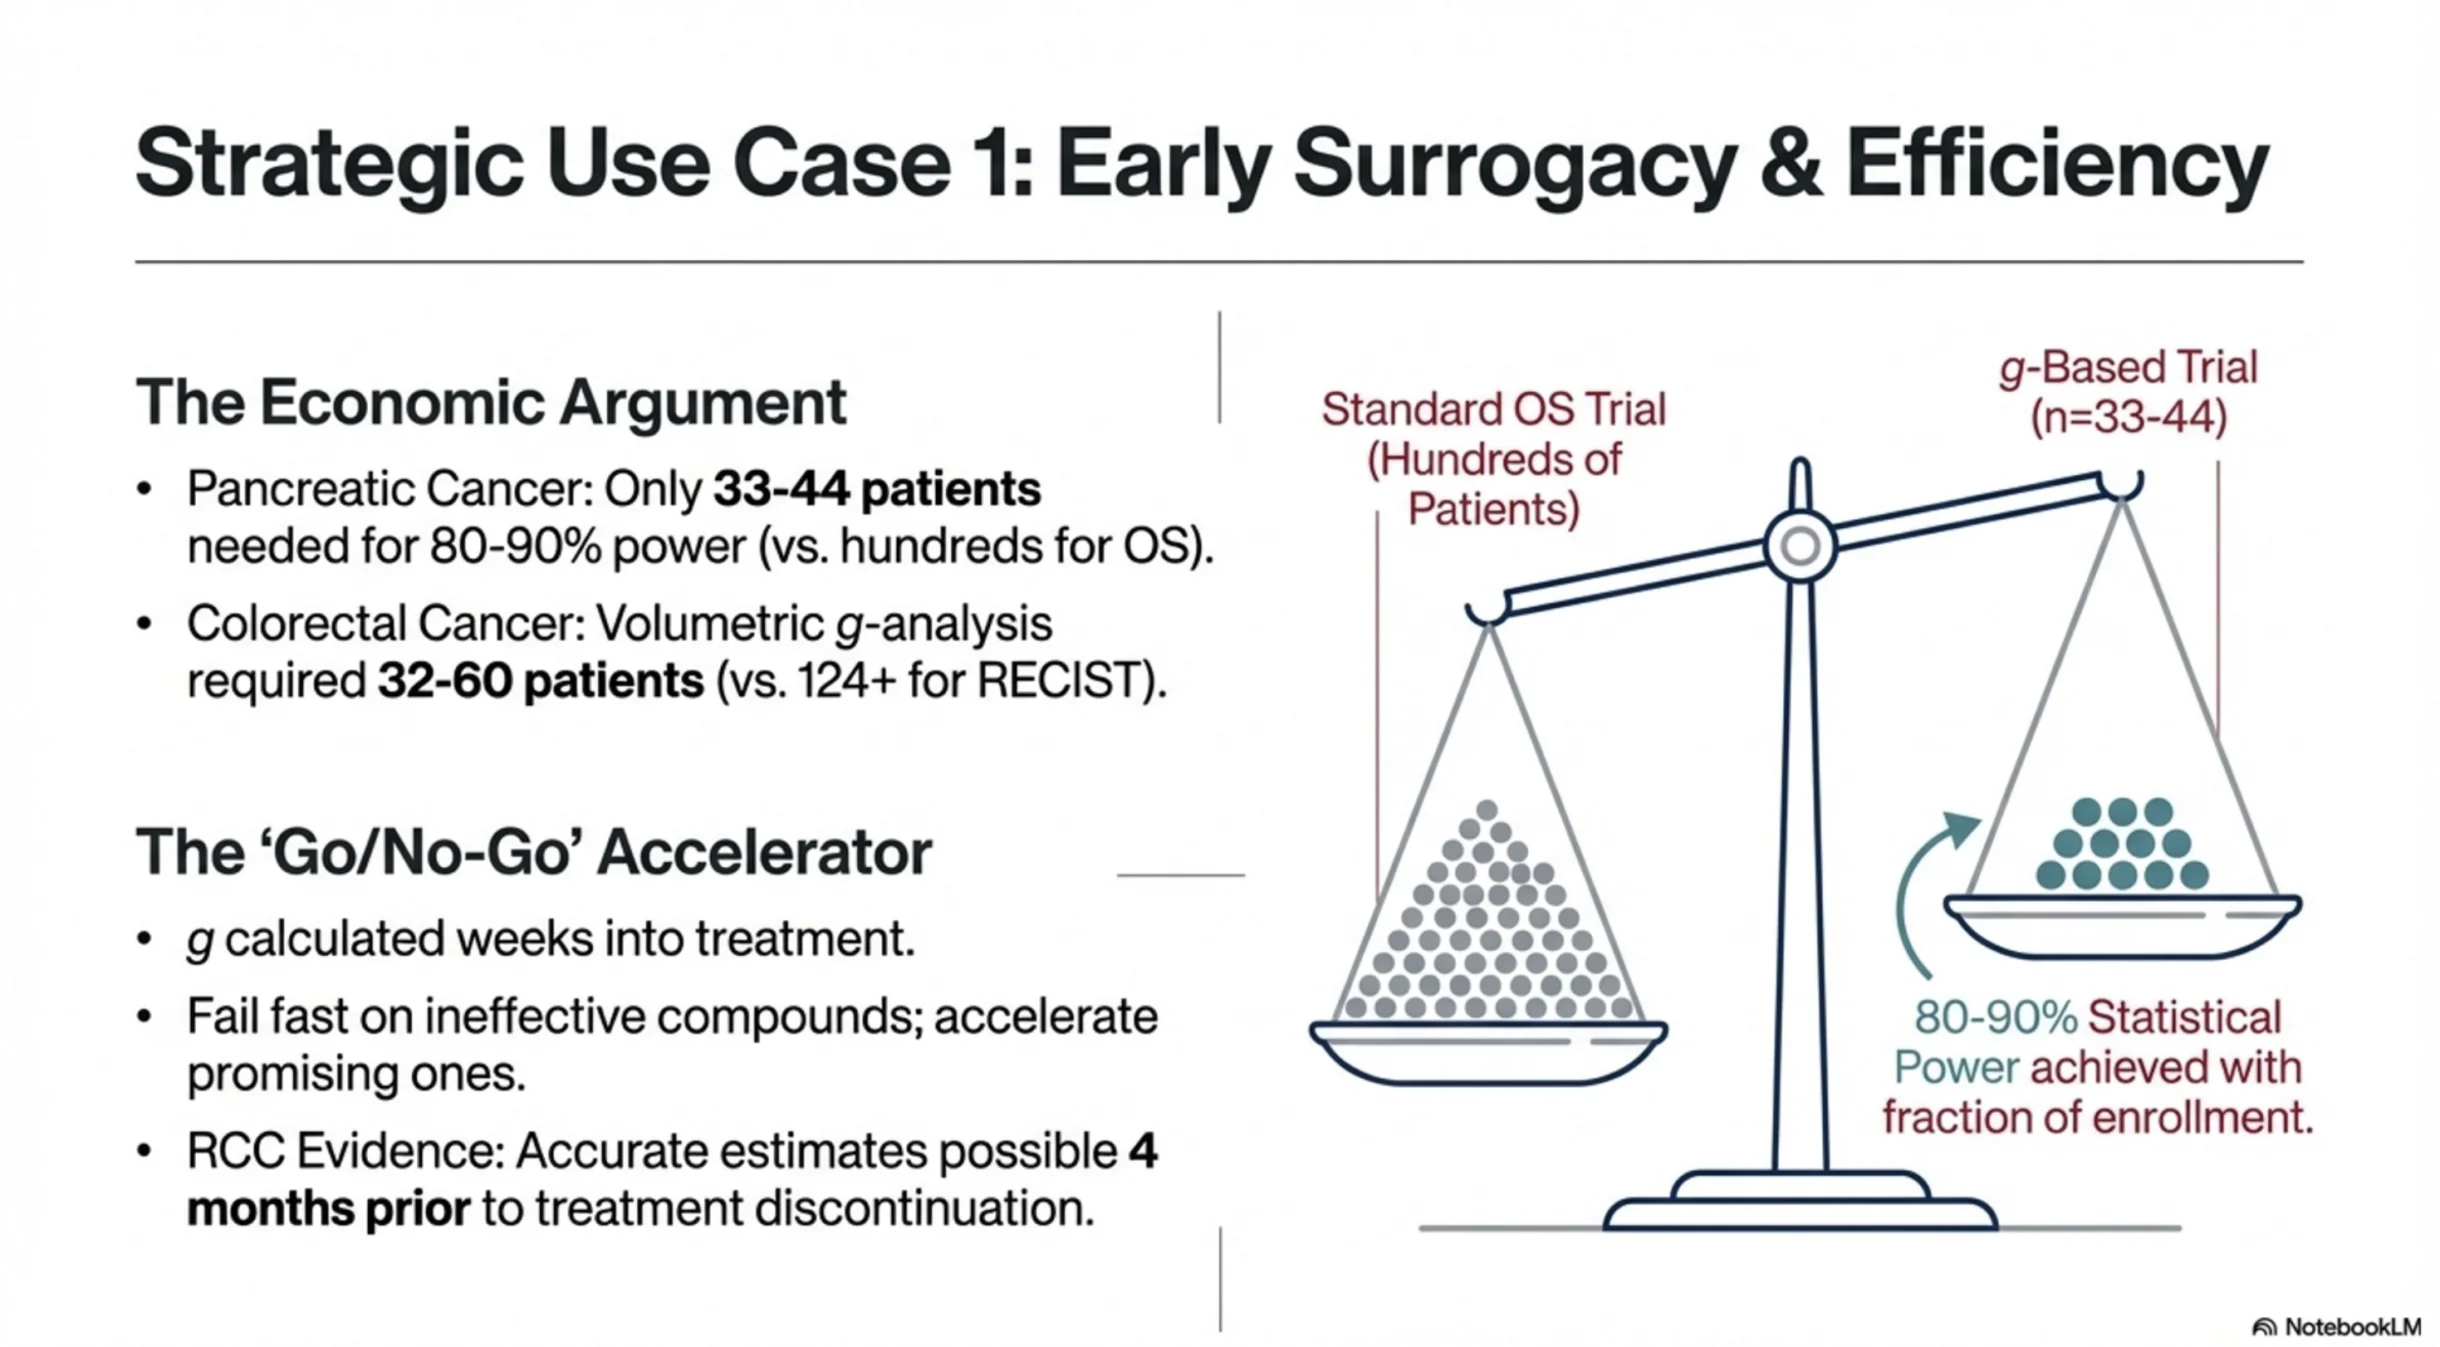
2. Earlier answers, with fewer patients. “g” complements “ORR” as a continuous variable rather than a binary one. In pancreatic cancer, modeling suggested that ~33–44 patients could detect treatment differences with 80–90% power, compared with hundreds typically required for OS. That’s not just about cost or efficiency — it’s about getting meaningful answers to patients sooner.
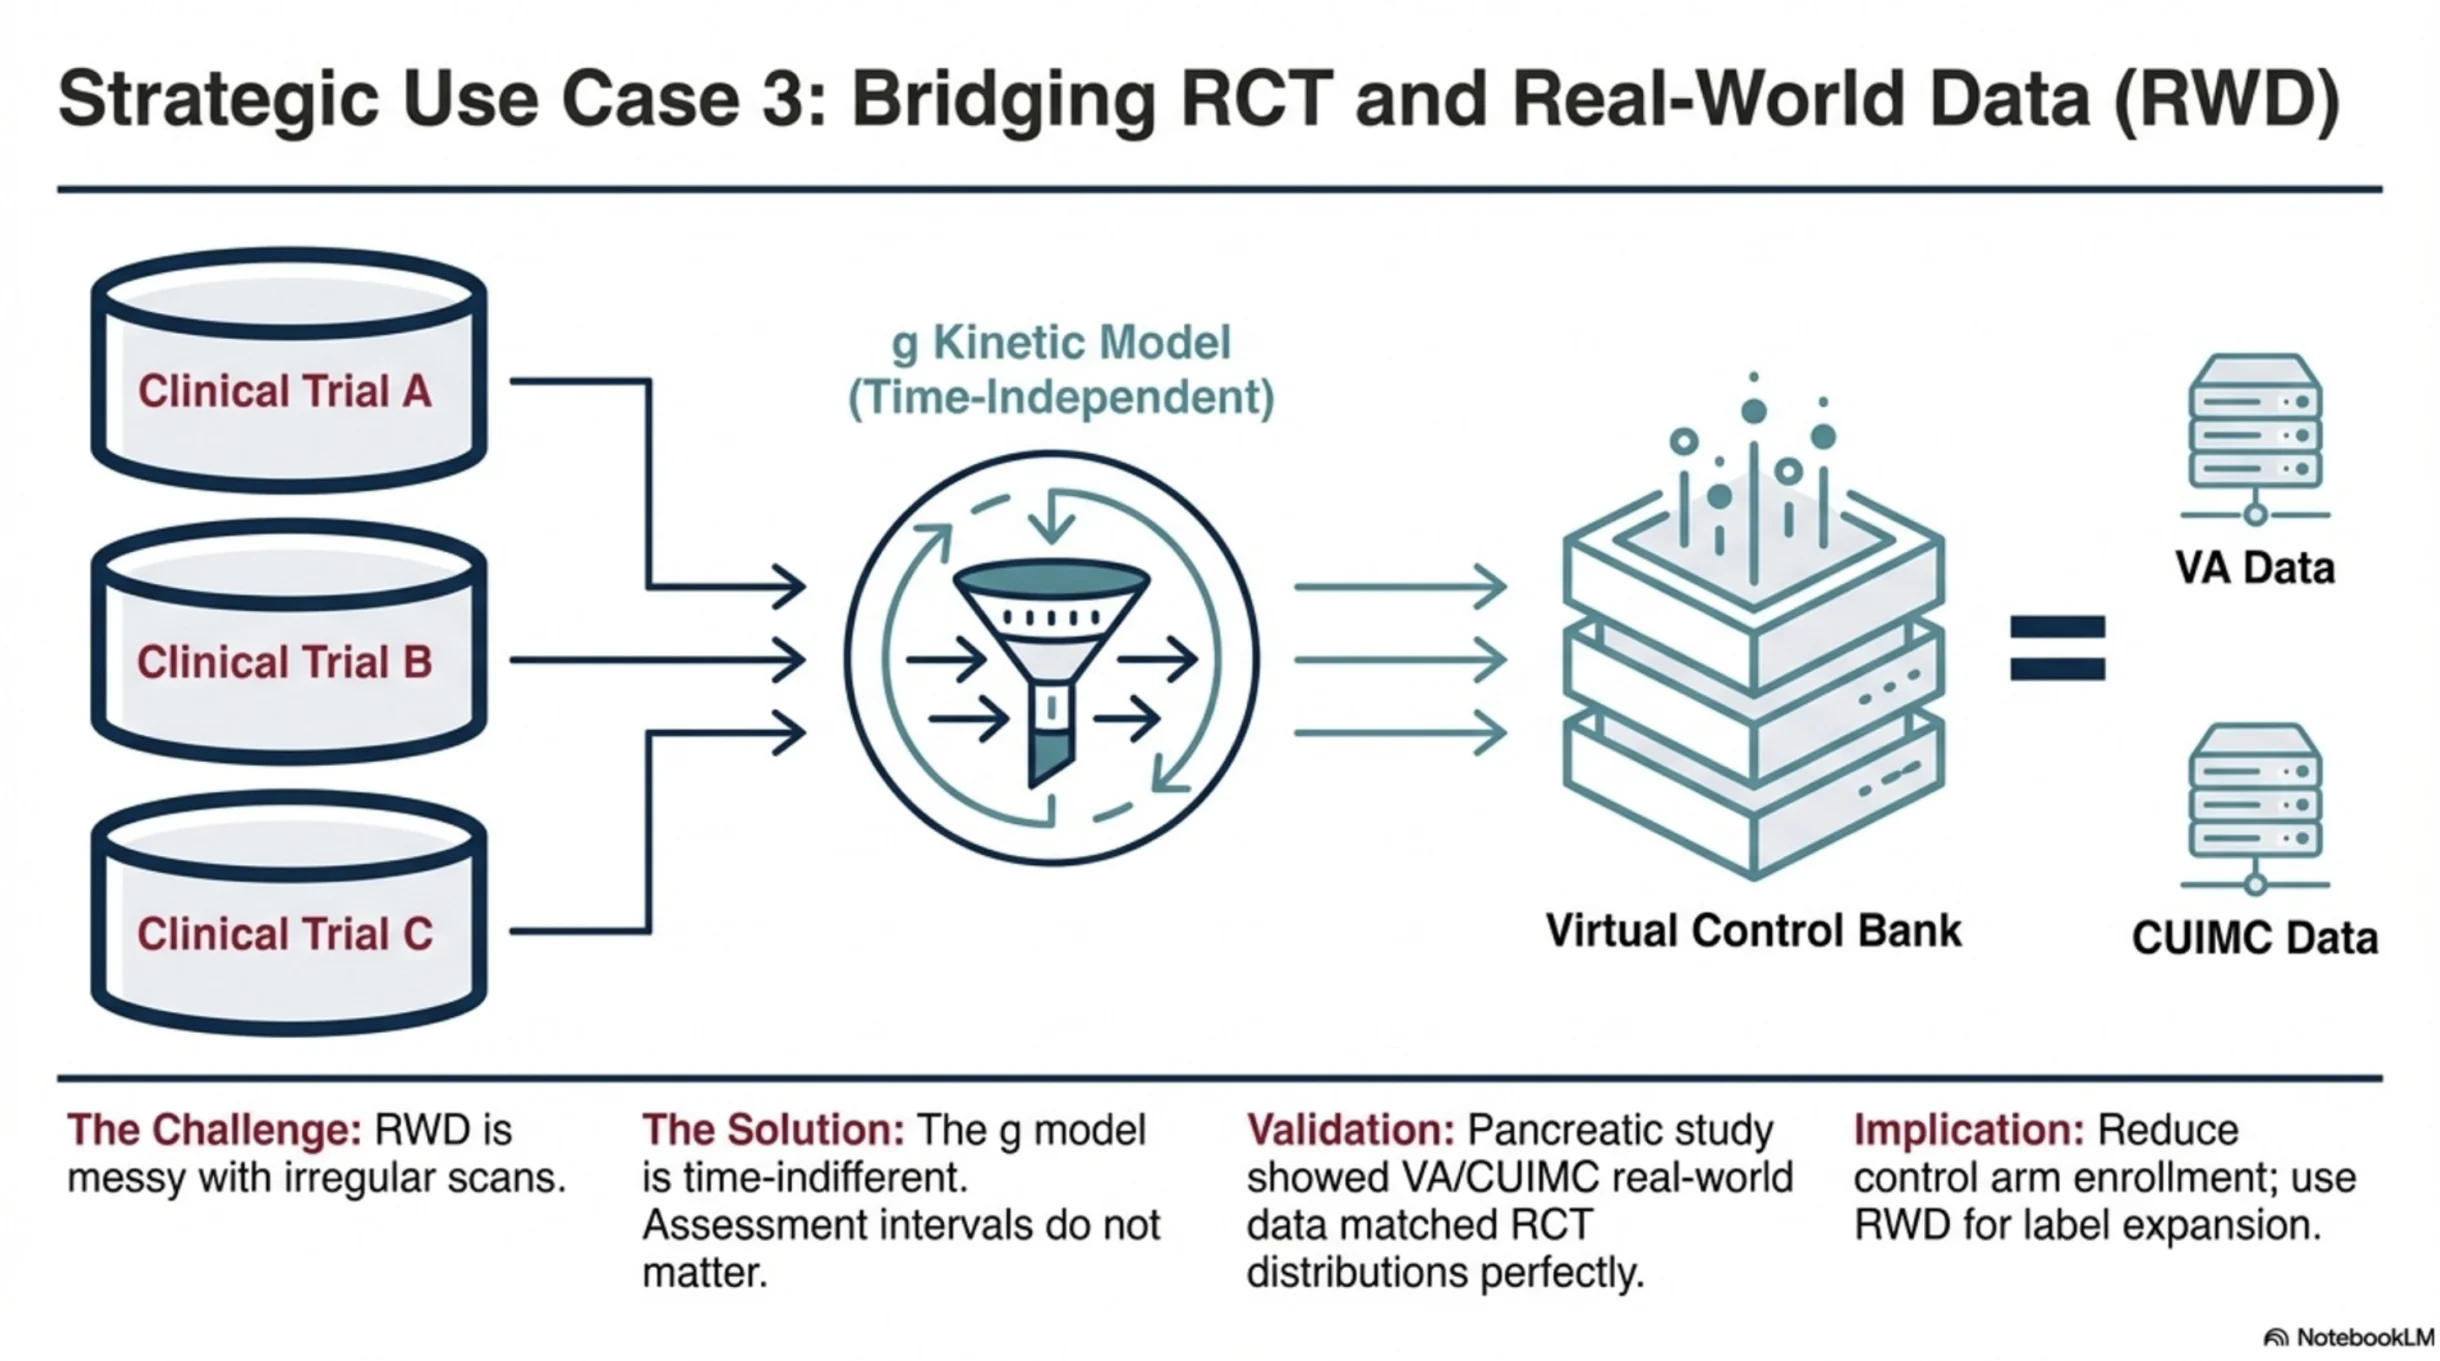
3. A credible bridge between trials and real-world data. The model is insensitive to scan timing intervals, which addresses one of the biggest challenges in real-world evidence: inconsistent assessments due to different measurement intervals. If this continues to hold up, g could become a genuine bridge between clinical trial efficacy and real-world effectiveness — including external controls and synthetic comparators.
If validated, this kind of metric could benefit almost everyone in oncology — and ultimately, our patients.
I’ve attached an AI-generated slide deck (NotebookLM) to help visualize the concepts. The figures are illustrative; please refer to the original publications for the actual data.”
Title: An FDA analysis of the association of tumor growth rate, overall survival and progression-free survival in patients with metastatic NSCLC
Authors: Justin N Malinou, Jiaxin Fan, Joyce Cheng, Yutao Gong, Yuan-Li Shen, Erin Larkins
Read the Full Article on The Oncologist

Title: Tumor Growth Rate Informs Treatment Efficacy in Metastatic Pancreatic Adenocarcinoma: Application of a Growth and Regression Model to Pivotal Trial and Real-World Data
Authors: Celine Yeh, Mengxi Zhou, Keith Sigel, Gayle Jameson, Ruth White, Rachael Safyan, Yvonne Saenger, Elizabeth Hecht, John Chabot, Stephen Schreibman, Béata Juzyna, Marc Ychou, Thierry Conroy, Tito Fojo, Gulam A Manji, Daniel Von Hoff, Susan E Bates
Read the Full Article on The Oncologist

Title: Estimation of tumour regression and growth rates during treatment in patients with advanced prostate cancer: a retrospective analysis
Authors: Julia Wilkerson, Kald Abdallah, Charles Hugh-Jones, Greg Curt, Mace Rothenberg, Ronit Simantov, Martin Murphy, Joseph Morrell, Joel Beetsch, Daniel J Sargent, Howard I Scher, Peter Lebowitz, Richard Simon, Wilfred D Stein, Susan E Bates, Tito Fojo
Read the Full Article on The Lancet Oncology

More posts featuring Cancer Research.