Brian Shields, Founder of KOL Pulse, shared a post on LinkedIn:
“Please take a look at this article evaluating visualization tools of social influence at major medical meetings such as American Society of Clinical Oncology (ASCO) and San Antonio Breast Cancer Symposium.
How can leaders in Pharma and Biotech marketing and medical affairs improve their understanding of the social influence within clinical trial discussions?
Are Social Visualizations key to better understanding of the influence of social media posts on X?
Please check out the article and share your thoughts on these tools.”
Visualizing Digital Opinion Leader Influence in Medicine.
Medical Meetings, especially in the world of Hematology and Oncology are major events for researchers, clinicians, patient advocates, investors, and especially Pharma and Biotech companies. Pharma Companies spend millions on their booth presence and evaluating the content and conversations of the Medical Meetings.
Phase II and III data presented at ASCO may result in a new FDA indication, a competitive advantage based on head to head data, or potentially a merger or acquisition of a small (or large) biotech firm. $Billions are at risk at every major medical conference in Hematology and Oncology.

What about the Virtual Conference?
The Virtual Conference or Social Media conference that happen along with the live conference is perhaps just as important as the live presentations for several reasons:
Instant Buzz on X:
- Digital Opinion Leaders share the clinical trial results and their perspectives on the data in real-time. Oftentimes, the researchers involved in these important clinical trials may create tweetorials and engage with other physicians in an open and transparent questions and answer.
- All of these data remain in the open, and often serve as the discussion points for further media covering these clinical trials.
Clinical Trial Sentiments and Criticisms:
- A Phase III trial presented at ASCO may often precede the FDA approval by nearly a year. This means that prior to a sales rep presenting these beautiful Interactive Visual Aid presentations on their Veeva iPad to physicians around the USA, Key Opinion Leaders are discussing the clinical trial data based on the feedback of their peers. Tweets from the ASCO24 discussion may often be the building blocks of Best of ASCO presentations around the globe as live speakers formulate their presentations.
- Also, content leaders such as Oncology Brothers, Dr. Vinay Prasad, and Blood Cancer Talk will produce short form, text and video presentations following each of these Major Medical conferences debating the pros and cons of the major clinical trials.
- These content producers are all digital savvy and their content is often influenced by their live discussions with peers on X during and after clinical trial presentations.
The Clinical Trial Information Cycle:
- Clinical Trials are often presented in various stages. Interim results, subset analysis, final results, NEJM publication, FDA ODAC discussions, and FDA approvals are all aspects of the Clinical Trial information cycle.
- Digital Opinion Leaders exert influence during each of these phases and depending on the data, the sentiments, reach, and engagement may change throughout a clinical trial’s information cycle. Brands may often be caught off guard when DOLs create a buzz around data in a publication which had previously been presented months prior at a major medical conference.
- The DOLs are content producers as well as researchers and clinicians. Within their specialties, they can create a buzz based on the value of their insights and the engagement of their social graph at various points in the media cycle.
Social Network Graph
- Too many companies are still using rudimentary social listening tools to evaluate the social discussions of their products and those of the competitors. Many of these tools use simple search algorithms for mentions of the specific products, or maybe even a simple AI based sentiment tool to pick up negative comments within a list of specific users or within a hashtag discussion.
- However, Digital Opinion Leaders and their discussions are too nuanced and complicated for these simple social listening tools. Visualization technologies may provide much more profound understandings of the various influence regarding clinical trial discussions of physician Key Opinion Leaders.
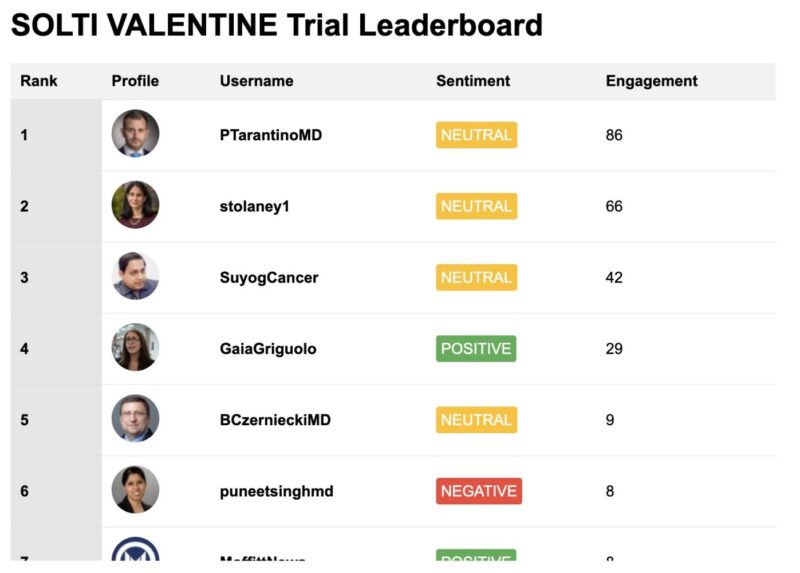
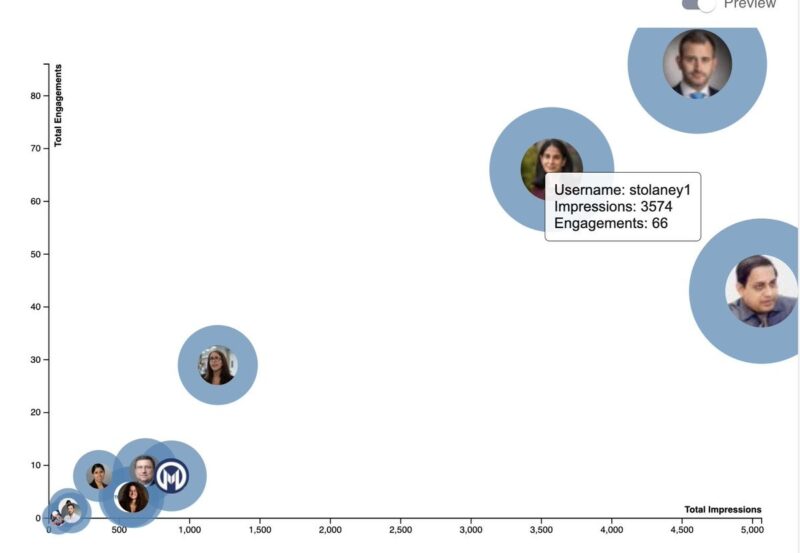
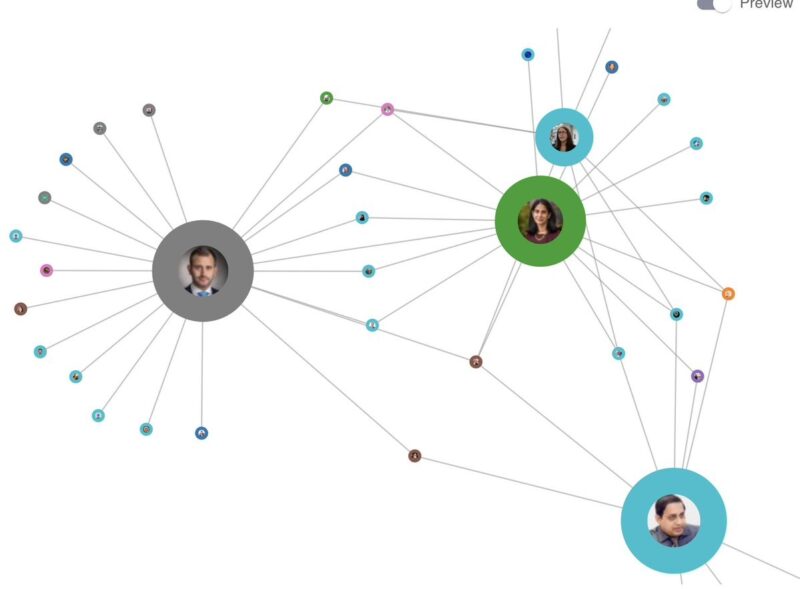
Below are 3 examples of Social Influence Visualizations of the recent SOLTI VALENTINE clinical trial discussions from the recent San Antonio Breast Cancer Symposium.
Influence Leaderboards:
- Digital Opinion Leaders’ influence within conference discussions are often presented based on the social measurements such as Impressions (or Views) or Engagements.
- A significant comment within a DOL thread, or the DOL unique reach within a social community may represent important insights that these rudimentary social leaderboards do not capture. On their own, these leaderboards really only serve as marketing tools, positive peer support, or even as clickbait by social listening firms. These leaderboards are always fun though.

Impressions versus Engagement:
- What’s more important?
- Who’s got both?
- This Matrix Diagram evaluating social impact within a social discussion of impressions vs engagements may be very helpful. Usually social influencers within a particular specialty may have great engagement with their peers, but perhaps they don’t have a broad following on X.
- Within the Medical Meeting discussions, their tweets are very important. Then there are those social influencers that have a broad X audience and their comments all tend to catch fire on X. Dr. Vinay Prasad, Dr. Aaron Goodman Papa Heme, and Dr. Eric Topol are a good example of physician social influencers that have a broad influence outside of the specific medical specialty of a conference.
- Their tweets may often rank at the top of impressions (and views) measurement tools.

Social Graph Visualization:
- A more advanced tool such as KOL Pulse can use Artificial Intelligence or some advanced python visualization tools to develop a social graph of the influencers within a particular social conversation.
- These tools can demonstrate the influence from a cluster perspective, quickly allowing a viewer to identify the social proximity of influencers to one another within a specific discussion. These tools may be used to identify regional influence, social activity within large academic centers, or the growing influence of fellows within a specific specialty.
- Also, these tools may be used to identify the influencers that expand the network of a conference or specific discussion.
- Also, do positive sentiments seem to get greater peer engagement than negative sentiments?
- Are Radiation Oncologists developing their own social graph within Pharma clinical trial discussions?
- How are surgeons engaging in a medical oncology discussion?
- These social network visualizations are amazing tools, especially when compared to the tweets guiding the data.

If you are interested in learning more about the network visualization tools of KOL Pulse please feel free to sign up for our newsletter or book a demo with our founder.”
More posts featuring Brian Shields.


