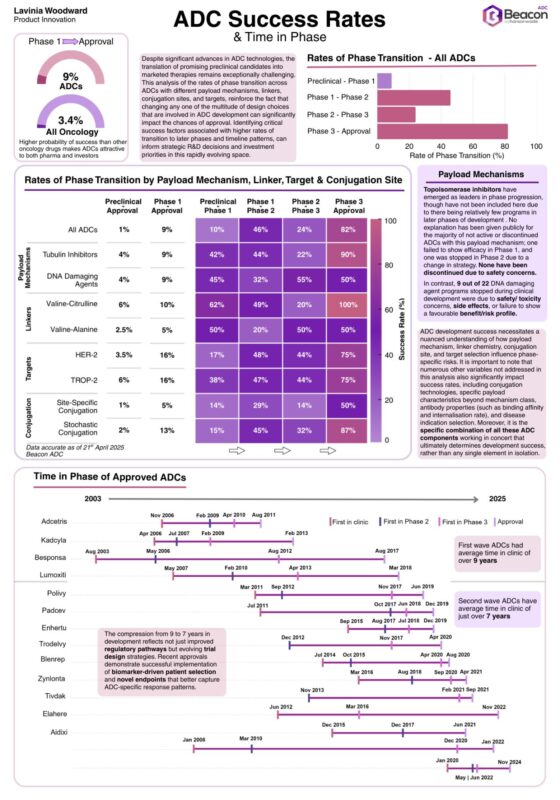
Paolo Tarantino: Recent ADCs took a median time of 7 years from clinical introduction to approval
Paolo Tarantino, Clinical Research Fellow at Dana-Farber Cancer Institute, shared Lavinia Woodward’s post on LinkedIn, adding:
“ADC success rate and time in Phase:
~10% of phase 1 ADCs makes it to approval (three times higher than other drug classes)
Recent ADCs took a median time of 7 years from clinical introduction to approval.
Shortest time for T-DXd (only 4 years!)”
Lavinia Woodward, Senior Product Development Producer at Beacon, shared on LinkedIn:
“ADC Success Rates, Timelines and Strategic Implications
Despite significant advances in antibody-drug conjugate (ADC) platform technologies, even promising preclinical data, translation into the clinic is tough, time-consuming, expensive, and often unsuccessful.
In the infographic below, I’ve used data from the Beacon ADC database to analyse the rates of phase transition for all ADCs, then by payload mechanism, linker, conjugation site specificity, and target, and mapped the time in clinic for approved ADCs.
ADC vs Oncology vs All Drugs – Success Rates
Phase 1 → 2: ADCs 46% | Oncology 58% | All drugs 66%
Phase 2 → 3: ADCs 24% | Oncology 33% | All drugs 49%
Phase 3 → Approval: ADCs 82% | Oncology 36% | All drugs 59%
Overall approval: ADCs 9%, vs 3.4% in oncology, and 14% across all drugs
Why ADC success rates differ from other drugs:
- Early risk: ADCs have lower Phase 1–2 (46%) and Phase 2–3 (24%) success due to off-target toxicity, complex PK, and biomarker variability.
- Late-stage strength: Once in Phase 3, ADCs achieve 82% approval, more than 2x oncology’s average (36%) thanks to smarter trial designs and biomarker strategies.
- Takeaway: ADCs are high-risk upfront, but high-reward when well-designed; precision, conjugation, and CMC and regulatory strategies are everything.
Accelerating Development Timeline Implications
The compression from 9 to 7 years in development reflects not just improved regulatory pathways but evolving trial design strategies. Recent approvals demonstrate successful implementation of biomarker-driven patient selection and novel endpoints that better capture ADC-specific response patterns.
Investment Implications
The success rate differentiation by design elements provides a framework for valuing ADC platforms beyond target selection. Portfolios balancing established design elements (cytotoxic payloads, validated targets) with novel approaches (dual-payload ADCs, ISACs, DACs), may optimise risk-adjusted returns.
It’s important to note that manufacturing capabilities and clinical development expertise may be as important as innovations in ADC constructs in determining commercial success.
For ADC developers, investors, and service providers, these benchmarks provide essential context for pipeline valuation, resource allocation, and strategic planning. Understanding these industry averages helps teams set realistic expectations and identify programs that are outperforming the norm.
It is important to note that this analysis doesn’t capture all variables affecting success, specific payload characteristics, antibody properties, and disease indication selection. Ultimately, success is determined by specific combinations of these components working in concert, not any single element in isolation.
Which ADC subsets would you like to see analysed for transition rates? What are you expecting the results to show?”

Explore more about ADCs on OncoDaily’s informative insight:
“Bladder Cancer Treatment: The Game-Changing Role of Antibody-Drug Conjugates (ADCs)”

-
Challenging the Status Quo in Colorectal Cancer 2024
December 6-8, 2024
-
ESMO 2024 Congress
September 13-17, 2024
-
ASCO Annual Meeting
May 30 - June 4, 2024
-
Yvonne Award 2024
May 31, 2024
-
OncoThon 2024, Online
Feb. 15, 2024
-
Global Summit on War & Cancer 2023, Online
Dec. 14-16, 2023
